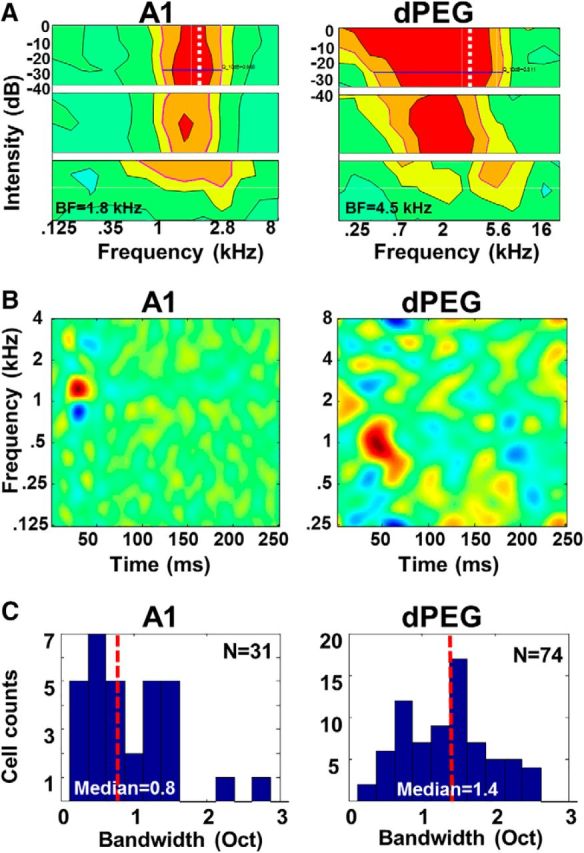
Figure 3.

A, Examples of multi-intensity tuning curves of an A1 neuron (left) and a dPEG neuron (right). Tuning curves were displayed on the same color scale. Tuning curves shown in the three panels from top-to-bottom reflect, respectively, onset responses (0–100 ms after stimulus onset), sustained responses (100–200 ms after stimulus onset), and off-responses (0–50 ms after stimulus offset). B, Examples of spectro-temporal receptive fields (STRFs) of an A1 neuron (left) and a dPEG neuron (right). C, Histograms of tuning-widths of A1 (left) and dPEG (right) neurons. The red vertical dashed line indicates the median of tuning-width in each distribution in A1 and dPEG. Bandwidths of dPEG neurons are wider than in A1. The values are indicated at the bottom. A1 has fewer neurons (N = 31) and the mean for A1 was skewed by a few outliers.
