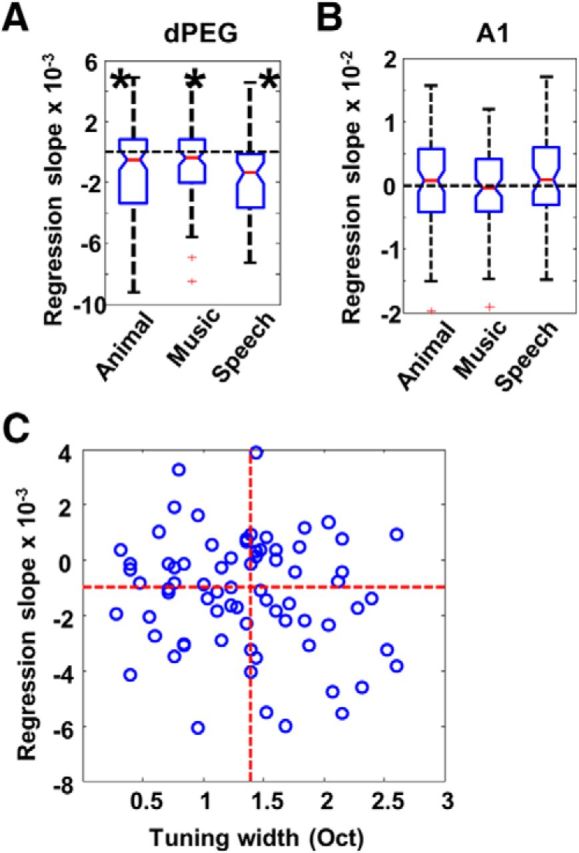
Figure 6.

A, Box-and-whisker plots of regression slopes for animal vocalizations, music and speech, measured in dPEG. All are significantly lower than zero, and there are no significant differences among them. Animal: p < 0.001; Music: p < 0.02; Speech: p < 0.001. B, Box-and-whisker plot of regression slopes for animal vocalizations, music, and speech, measured in A1. None of them is significantly lower than zero. C, There was a marginal (not significant) negative relationship between regression slopes and tuning-width in dPEG neurons.
