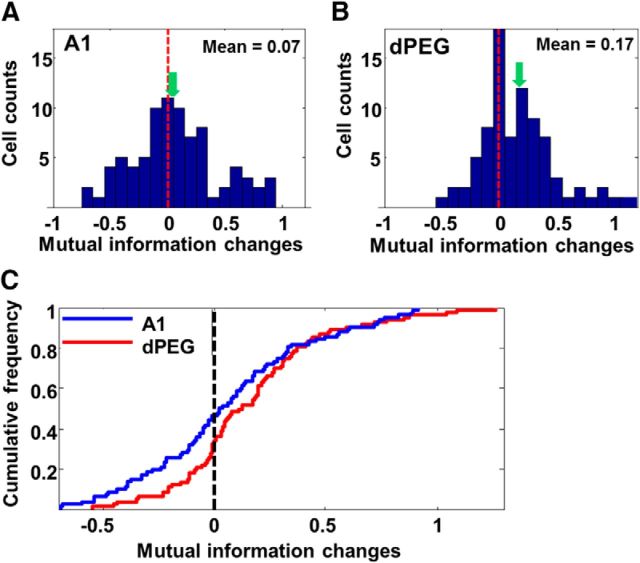
Figure 7.
A, Histograms of mutual information changes (familiar − novel) during habituation in A1. There was no significant change in mutual information. The vertical dashed lines indicate zero, and the green arrows mark the mean of each distribution. B, Same plots as in A, except for all dPEG cells. C, Cumulative frequency distribution of mutual information changes in A1 (blue) and dPEG (red).

