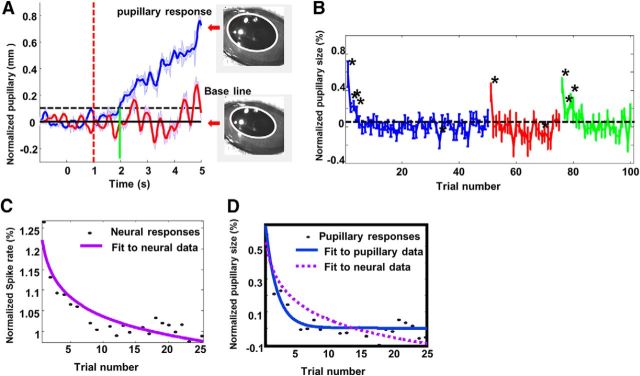
Figure 8.
A, The temporal profile of pupillary responses in response to novel sounds (blue trace) and familiar sounds (red trace). Stimulus onset time (red dashed line), threshold (black dashed line), and latency (green vertical line) are all defined as in Figure 5E. An example of pupil image after presentation of a novel sound (top) and at baseline (before stimulus onset). Pupillary shape is outlined with a white trace. B, Population habituation curve of pupillary response to novel stimuli (blue), familiar stimuli (red), and reversed stimuli (green). Asterisks indicate the trials in which the averaged pupillary responses are significantly larger than baseline. Both novel stimuli and reversed stimuli induced significant pupillary responses in the initial few trials. Pupillary responses to familiar sounds are not significantly larger than the base line, except for the first stimulus in a block. C, Best curve fit for the population habituation curve of dPEG neurons in response to novel stimuli (same as the curve consisting of blue dots in Fig. 5D). A power function is fit to the data (purple trace). D, Blue solid trace shows the best fit for the pupillary habituation curve in response to novel stimuli. The purple dashed line shows the best exponential fit for the population habituation curve of neural responses in C. Habituation in neural responses is much slower and continued even after habituation of pupillary responses plateaued.

