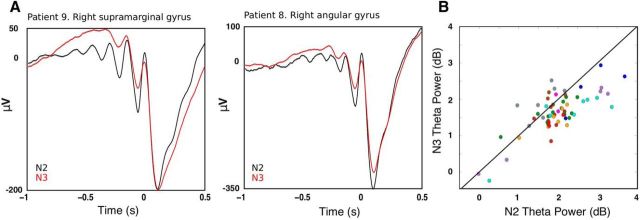
Figure 3.
Comparing N2 and N3 TBs. A, Theta oscillations before DS troughs were more pronounced for N2 than for N3 DSs. Average waveforms of the DS with the top quartile of prior theta power are shown from two patients within N2 in black (n = 677 in Patient 9 and 174 in Patient 8) and N3 in red (n = 913 in Patient 9 and 635 in Patient 8). Unfiltered averages are locked to the filtered theta peak just preceding the DS trough. B, Power within theta (5–8 Hz) range −500 ms to 0 relative to DS trough for each channel (channels from a given patient have the same color). Most dots are below the diagonal, indicating that theta power was greater for N2 than for N3 (t = −3.13, p = 0.002, mixed-effects model with patient as random effect and channel as nested random effect).

