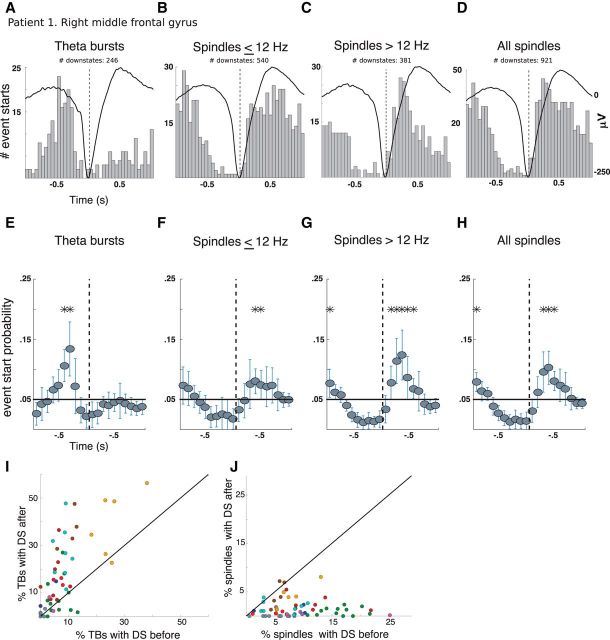
Figure 4.
Cortical theta precedes DSs and both slow and fast spindles follow. A–D, Event-related histograms showing the timing of the start of TBs (A), spindles ≤ 12 Hz (B), spindles >12 Hz (C), and all spindles (D) relative to the DS trough at a single bipolar channel in the right middle frontal gyrus of Patient 1 during both N2 and N3 sleep. E–H, Histograms from all channels normalized by the total number of counts ±1 s and pooled in 100 ms bins. The black line indicates chance level and probability estimates per bin across channels were calculated using linear mixed-effects models. Stars indicate bins where events occur significantly more than chance (Bonferroni adjusted, p < 0.05). Error bars indicate 95% confidence intervals (CIs). I, Scatterplot for each channel of the proportion of TBs with the DSs within 500 ms after (y-axis) versus the proportion with the DS within 500 ms before (x-axis). J, Same as I but for spindles. All cortical channels with at least 50 events were included. Most channels (dots) in I are above the diagonal, indicating that the DS trough usually occurs after TB onset; in contrast, most channels in J are below the diagonal, indicating that the DS trough usually occurs before spindle onsets.

