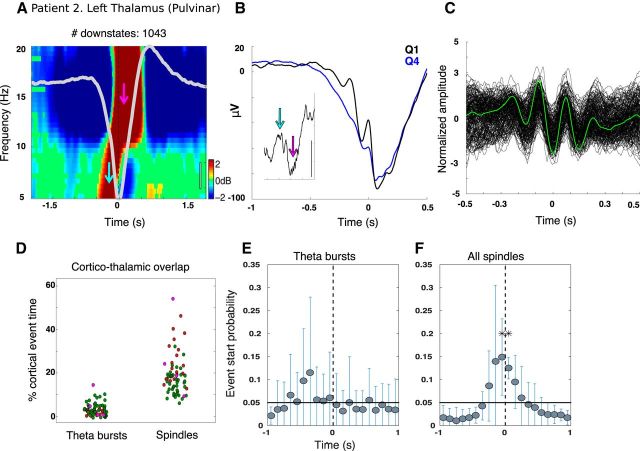
Figure 6.
Thalamic theta during NREM sleep. A, Example time–frequency representations locked to DS troughs for a bipolar thalamic channel from Patient 2 showing increased power in the theta range before the trough (cyan arrow) and in the spindle range just after the trough (pink arrow). The average DS is overlaid in light gray. Black scale bar indicates 20 μV. (See Fig. 2B in Mak-McCully et al., 2017, for time–frequency plots extending to 100 Hz). B, Prior theta power is not solely driven by DS waveform shape, but displays oscillatory activity in the theta range after averaging the raw LFP locked to the first theta peak preceding the DS trough (as in Fig. 2B,E). The inset displays a single trace from the top quartile for ± 1 s around DS trough. Scale bar indicates 100 μV. Cyan and pink arrows show individual theta and spindle events, respectively. C, All detected theta events locked to the deepest trough for the same channel as A and B. D, Proportion of cortical and thalamic overlap for TBs and spindles. Each dot is a different channel; dots from the same patient share the same color. y-axis indicates the proportion of time a given cortical channel has a TB (spindle) overlapping with a thalamic TB (spindle) after subtracting the amount of overlap expected by chance. Spindles show a greater degree of corticothalamic overlap compared with TBs (t = 14.2, p = 1.2e-45; patients as random effects, corticothalamic pairs as nested random effects). As in Figure 4, E–H, DS-locked event-related histograms from 8 thalamic channels, normalized by the total number of counts ±1 s and pooled in 100 ms bins are plotted for the start times of: TBs (E) and all spindles (F).

