Figure 7.
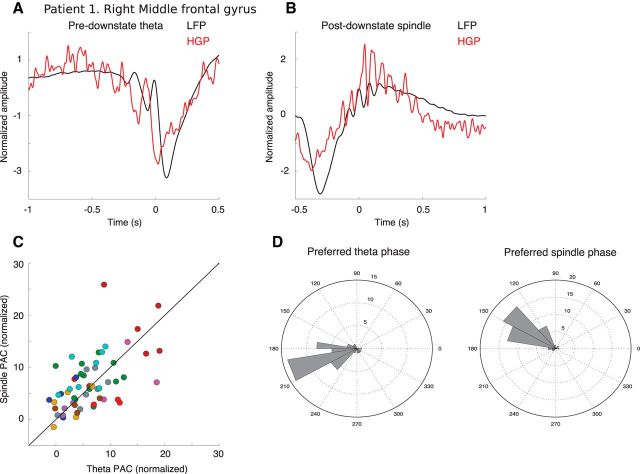
Theta and spindles couple to HG power differently. A, B, Patient 1, right middle frontal gyrus. A, Average of the top quartile of DSs (ranked by pre-DS theta power) locked to the first prior theta peak (black), as well as the average of HG power (60–100 Hz) for the same events (red). B, Average of the top quartile of DSs (ranked by post-DS spindle power) locked to the first filtered spindle peak following the DS trough (black), as well as the average of the HG power. C, Magnitude of PAC between theta phase and HG (x-axis) versus spindle phase and HG (y-axis) for all bipolar channels with unity line overlaid for reference. Overall, a similar level of coupling is observed for TBs versus spindles. D, Preferred phase of either theta or spindle events for each channel that had significant PAC. Radial scale is number of channels. The preferred phase is consistent for each type of wave and differs significantly between TBs and spindles (parametric Watson–Williams test, F = 26.5, p = 1.6e-6).

