
Fig. 2.
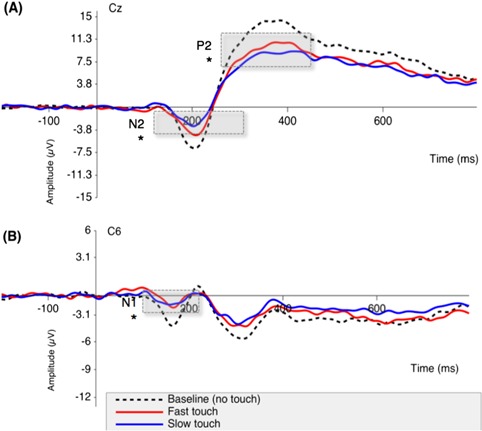
(A) Effect of touch condition on the N2-P2 waveform measured at the vertex (Cz). (B) Effect of touch condition on the N1 waveform measured at the contralateral side of stimulation (C6). N1, N2 and P2 local peak amplitude was significantly smaller in the slow touch compared to the fast touch condition, as denoted by asterisks. Baseline pain (no touch) as a covariate was statistically significant across the N1, N2 and P2 local peak amplitude.