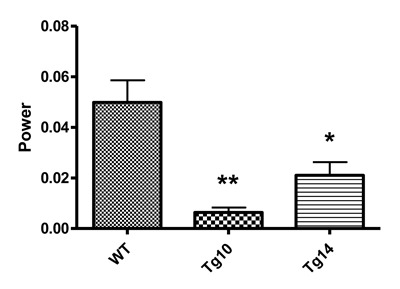
Figure 4.

Quantitative analysis of locomotor rhythmicity of the PKR2-PK2 transgenic mice. FFT value, an index for the amplitude of the locomotor circadian rhythmicity was plotted. Both the TG10 and TG14 mice displayed significantly reduced amplitude of circadian rhythmicity. * p < 0.05, ** p < 0.01.
