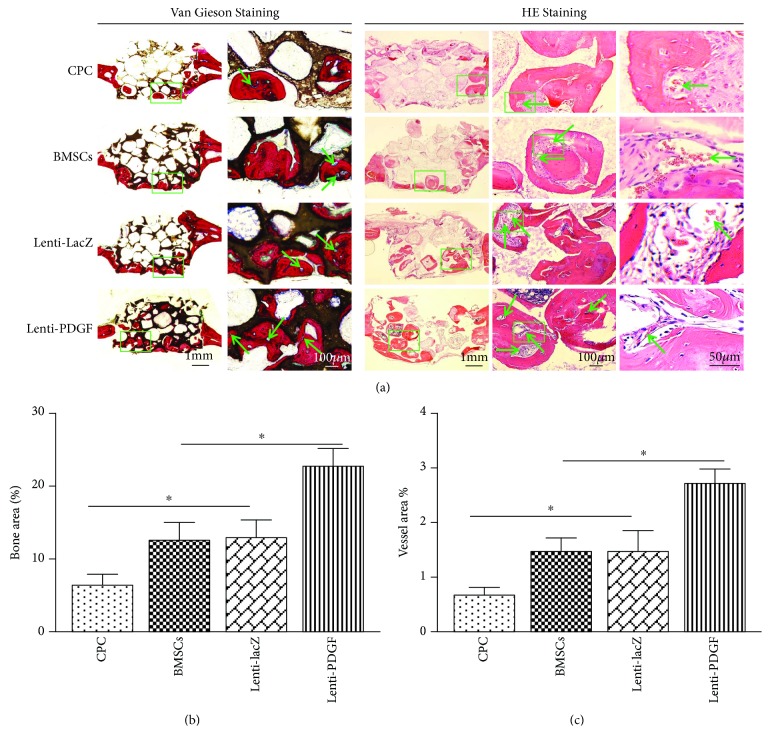
Figure 7.
Histological analysis of newly formed bone and blood vessel in implants. (a) Histological images of each group. Left panel: Van Gieson staining, the new bone appears red, CPC appears black, and blue spots indicate blood vessels (green arrow); right panel: HE staining. The newly formed bone tissue was infiltrated with blood vessels (green arrow) with intraluminal red blood cells. (b) Histomorphometric analysis of the newly formed bone area. (c) Histomorphometric analysis of newly formed vessel area. ∗P < 0.05.

