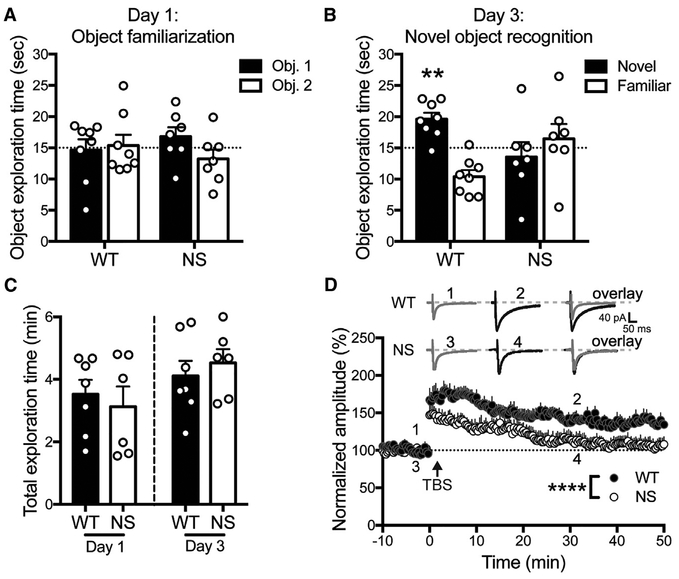
Figure 1. Ptpn11D61G/+ (NS) Mice Exhibit Deficits in Behavior and Synaptic Plasticity.
(A) On day 1, WT and NS mice do not prefer one of two identical objects over chance. Data in (A)–(C) are means + SEM, and symbols are exploration times from individual animals (n = 8 WT and 7 NS mice). WT: p = 0.85; NS: p = 0.28 (one-sample t test of object 1 exploration time versus 15 s [dotted line]).
(B) On day 3, WT mice prefer to explore a novel object, whereas NS mice explore both objects equally. WT: **p = 0.0029; NS: p = 0.56 (one-sample t test of novel object exploration time versus 15 s).
(C) WT and NS mice spent equal time accumulating 30 s object exploration time on both days. Day 1: p = 0.62; day 3: p = 0.54 (unpaired t test).
(D) NS mice display impaired theta-burst stimulation (TBS)-induced LTP. Insets show the average of two EPSCs before (WT: 1, NS: 3) and after (WT: 2, NS: 4) TBS, and their overlay. Data are means + SEM (n = 8 neurons) normalized to the baseline amplitude. ****p < 0.0001, effects of genotype and time; interaction p = 0.57 (two-way ANOVA).

