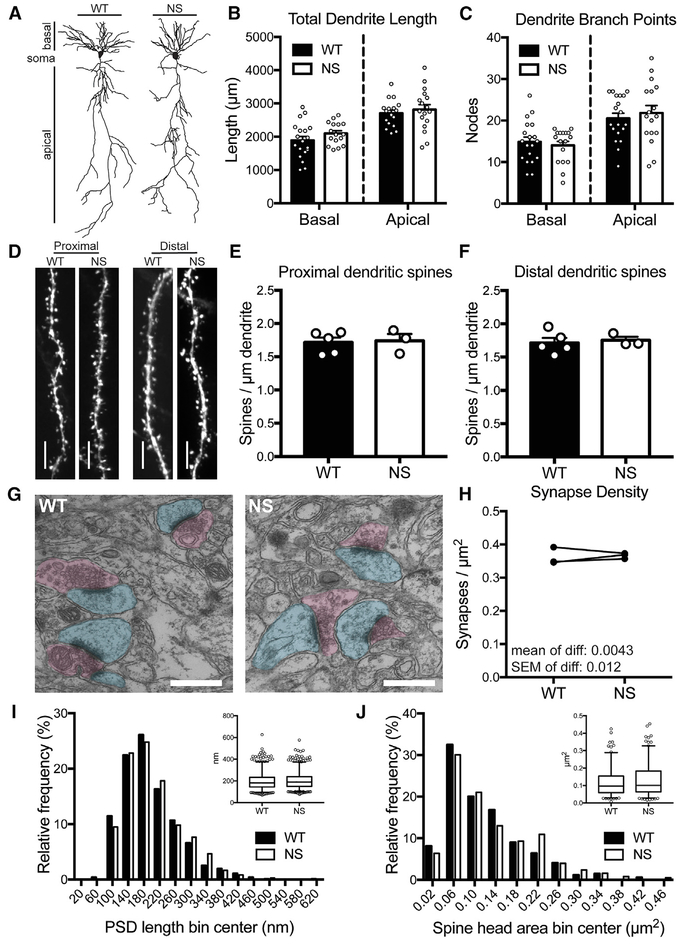
Figure 2. NS Mice Have Normal CA1 Pyramidal Neuron Structure.
(A) Representative reconstructions of CA1 pyramidal neuron dendrite arbors from P40–P50 WT and NS mice.
(B and C) Basal and apical dendrite length (B) and number of branch points (C) of CA1 pyramidal neurons are unchanged in NS mice versus WT. Bars show mean + SEM, and circles show data from individual neurons (napical length = 17 WT and 17 NS neurons, nbasal length = 19 WT and 16 NS neurons; napical nodes = 19 WT and 17 NS neurons, nbasal nodes = 19 WT and 17 NS neurons). Basal length: p = 0.19; apical length: p = 0.55; basal nodes: p = 0.59; apical nodes: p = 0.55 (unpaired t test).
(D) Representative images of dendrite segments from Thy1-GFP-expressing WT and NS mice. Scale bars, 5 μm.
(E and F) Spine density on oblique apical dendrites proximal (E) or distal (F) to the soma are unchanged in NS mice compared with WT (p = 0.85). Bars show mean + SEM, and circles show average spine density from individual animals (n = 5 WT and 3 NS mice). Distal: p = 0.85; proximal: p = 0.72 (unpaired t test).
(G) Representative electron micrographs from WT and NS stratum radiatum. Post-synaptic regions are pseudo-colored in cyan, and presynaptic regions in magenta. Scale bars, 500 nm.
(H) Synapse density is unchanged in NS versus WT littermates. Data are average synapse density per animal, with paired littermates connected by lines (n = 3 WT and 3 NS mice). The mean and SEM of the differences are indicated on the graph. p = 0.76 (paired t test).
(I) The average post-synaptic density (PSD) length is unchanged in NS compared with WT. Histogram shows the population of PSD lengths (n = 1,031 WT and 1,100 NS PSDs) in 40-nm bins. Inset shows box (25th percentile, median, and 75th percentile) and whisker (2.5%–97.5%) plot. p = 0.098 (Mann-Whitney test).
(J) The average spine head area is unchanged in NS mice compared with WT. Graphs are as described for (I), and the histogram bin size is 0.04 μm2. p = 0.091 (Mann-Whitney test).

