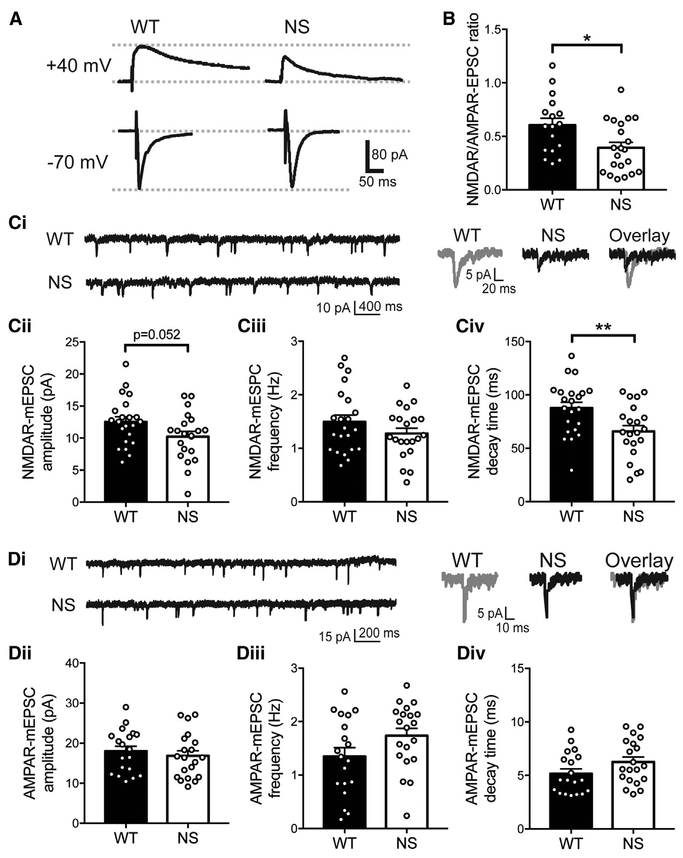
Figure 3. NMDA Receptor Function Is Selectively Disrupted in NS Mice.
(A) Representative traces of NMDAR-EPSCs (+440 Mv holding potential) and AMPAR-EPSCs (−70 Mv) recorded from the same WT and NS neurons.
(B) The NMDAR/AMPAR-EPSC ratio is reduced in NS mice compared with WT (n = 17 WT and 21 NS neurons). In all panels, data were analyzed by un-paired t test, histograms show means + SEM, and symbols are data from individual neurons. *p =0.014.
(C) (i) Representative NMDAR-Mepsc recordings (left) and average currents (right) recorded from WT and NS neurons (n = 22 WT and 21 NS neurons). NMDAR-Mepsc amplitude (ii) is reduced (p = 0.052), frequency (iii) is unchanged (p = 0.19), and decay time (iv) is reduced (**p = 0.0066) in NS mice compared with WT.
(D) (i) Representative AMPAR-Mepsc recordings (left) and average currents (right) recorded from WT and NS neurons (n = 19 WT and 20 NS neurons). AMPAR-Mepsc amplitude (ii; p = 0.52), frequency (iii; p = 0.079), and decay time (iv, p = 0.097) are unchanged in NS mice compared with WT.

