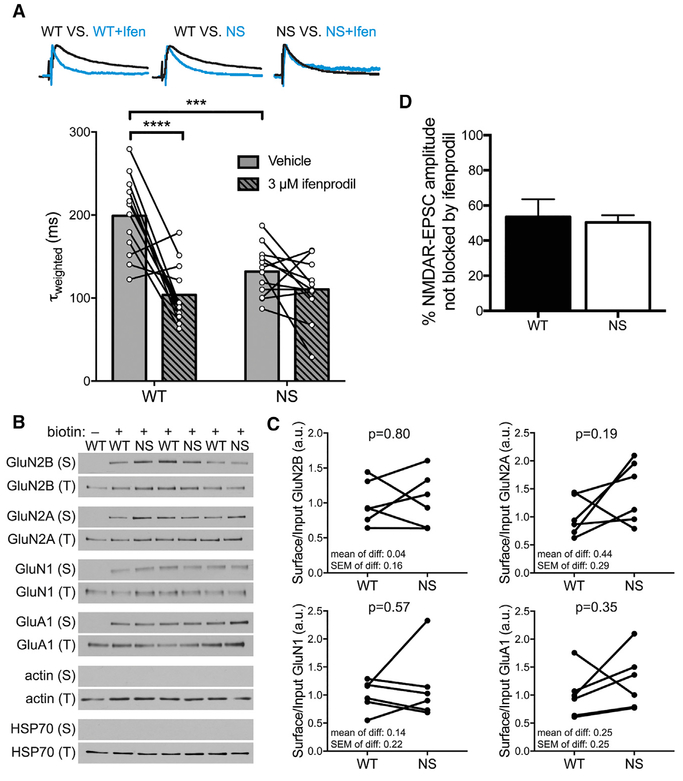
Figure 4. GluN1:GluN2B Diheteromers Are Selectively Disrupted in NS Mice, whereas NMDAR Subunit Surface Levels Are Unaltered.
(A) The NMDAR-EPSC τweighted is faster in NS mice than WT and is not further sped by ifenprodil. Traces are representative peak-scaled SC-evoked NMDAR-EPSCs from indicated conditions. Histogram bars are mean τweighted, and connected circles are τweighted of individual neurons before and after ifenprodil (n = 12 WT and 12 NS neurons). Data were analyzed by two-way repeated-measures ANOVA (effects of genotype: p = 0.008; ifenprodil: p < 0.0001; and interaction: p = 0.0041) followed by post hoc Holm-Sidak test (WT-NSvehicle: adjusted p = 0.0002; WT-NSifenprodil: adjusted p = 0.67; vehicle-ifenprodilWT: adjusted p < 0.0001; vehicle-ifenprodilNS: adjusted p = 0.20). ***p < 0.001; ****p < 0.0001.
(B) Representative western blots show surface (S) and total (T) levels of the indicated proteins in surface biotinylation assay.
(C) Quantifications of blots in (B) show that surface levels of NMDAR and AMPAR subunits are not different in NS mice compared with WT. Data are surface divided by total signal for each protein normalized to the WT mean, and littermate WT and NS mice are connected by lines (n = 6 WT and 6 NS mice). The mean, SEM and p value (paired t test) of the differences are indicated on the graphs.
(D) The percent of evoked NMDAR-EPSC amplitude blocked by ifenprodil treatment is not different between WT and NS mice (n = 8 WT and 9 NS neurons). Data are shown as means + SEM; p = 0.78 (Welch’s t test).

