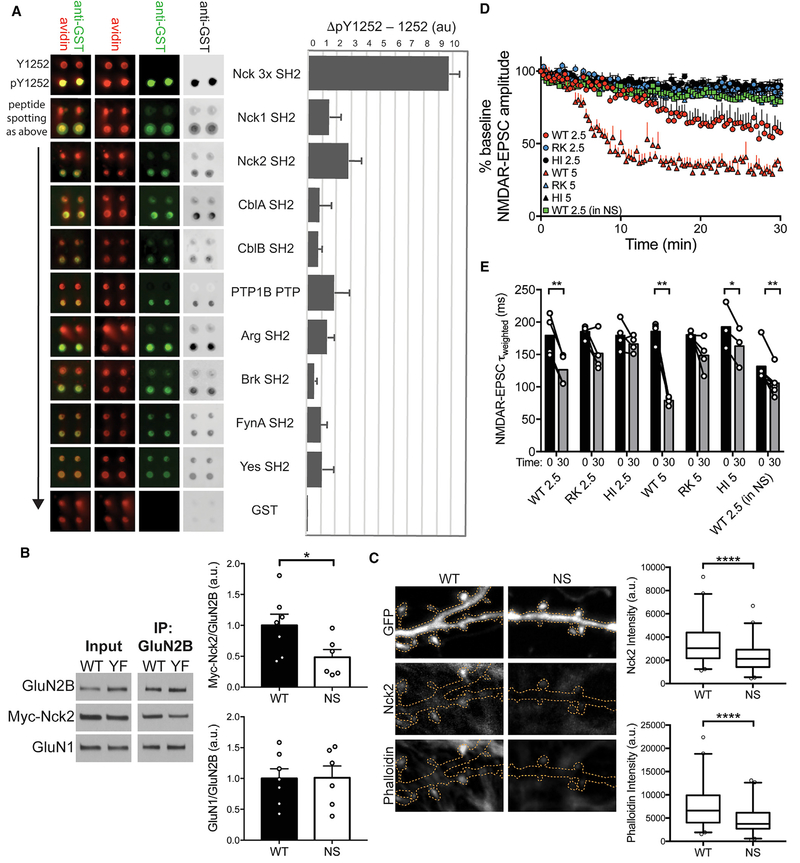
Figure 7. GluN2B Py1252 Binds SH2-Domain-Containing Proteins and Scaffolds Nck2 to Regulate NMDAR-EPSC Properties.
(A) Top hits identified by SH2-domain binding screen. (Left) Signal for anti-GST (green) and avidin (red) indicate probe binding and peptide loading, respectively. (Right) Background subtracted signal (ΔpY1252–Y1252) is shown in histogram. Nck 3x contains three fused Nck1 SH2 domains. A screen schematic can be found in Figure S3, and complete screen results are in Figure S4 and Table S3.
(B) (Left) Representative western blots of GluN2B WT or Y1252F (YF) and Myc-Nck2 co-immunoprecipitations (coIPs). (Right) 50% less Myc-Nck2 coIPed with GluN2B YF than WT, whereas GluN1 coIP is unchanged. Data are means of the ratio of IPed protein to GluN2B normalized to the WT mean + SEM. Nck2: *p = 0.046; GluN1: p = 0.96 (unpaired t test). n = 7 WT and 6 YF cultures. Control IgG IP can be found in Figure S6.
(C) (Left) Representative immunofluorescence images of WT and NS neurons transfected with GFP and stained for Nck2 and phalloidin. Orange dotted lines show neuron morphology from GFP fill. (Right) Dendritic spine Nck2 and phalloidin intensity are reduced in NS neurons. ****p < 0.0001 for both (Mann-Whitney test). Graphs are box (25th percentile, median, and 75th percentile) and whisker (2.5%–97.5%) plots. n = 86 WT spines from 8 neurons and 83 NS spines from 10 neurons.
(D) WT GST-Nck2 SH2 domain reduces NMDAR-EPSC amplitude. Data are mean NMDAR-EPSC amplitudes normalized to the first amplitude, and were analyzed by one-way ANOVA of the relative amplitude at 30 min (p < 0.0001) followed by post hoc Tukey test (at 2.5 μg/mL: WT versus RK, p = 0.011, WT versus HI, p = 0.0018, RK versus HI, p = 0.99; at 5 μg/mL: WT versus RK, p < 0.0001, WT versus HI, p < 0.0001, RK versus HI, p = 0.93; at 2.5 μg/mL into NS: WT 2.5 versus WT 2.5 (in NS), p = 0.038, RK 2.5 versus WT 2.5 (in NS), p = 0.96, HI 2.5 versus WT 2.5 (in NS), p = 0.58). n (neurons) = 4 each WT 2.5, WT 5, RK 2.5, RK 5, and HI 2.5, n = 3 HI 5, and n = 6 WT 2.5 (in NS). Representative traces can be found in Figure S5A. AMPAR-EPSCs and Rs were unchanged by GST-Nck2 SH2 infusion; these data are in Figures S5B and S5C.
(E) WT GST-Nck2 SH2 domain speeds NMDAR-EPSC τweighted. WT 2.5: p = 0.0018, RK 2.5: p = 0.10, HI 2.5: p = 0.26, WT 5: p = 0.0019, RK 5: p = 0.12, HI 5: p = 0.049, WT 2.5 (in NS): p = 0.0031 (paired t test). Paired infusion start and end values are connected by lines, and bars show mean decay time. *p < 0.05; **p < 0.01. WT SH2 domain occluded the effect of ifenprodil on both amplitude and decay; these results are in Figures S5D and S5E.

