
Figure 3.
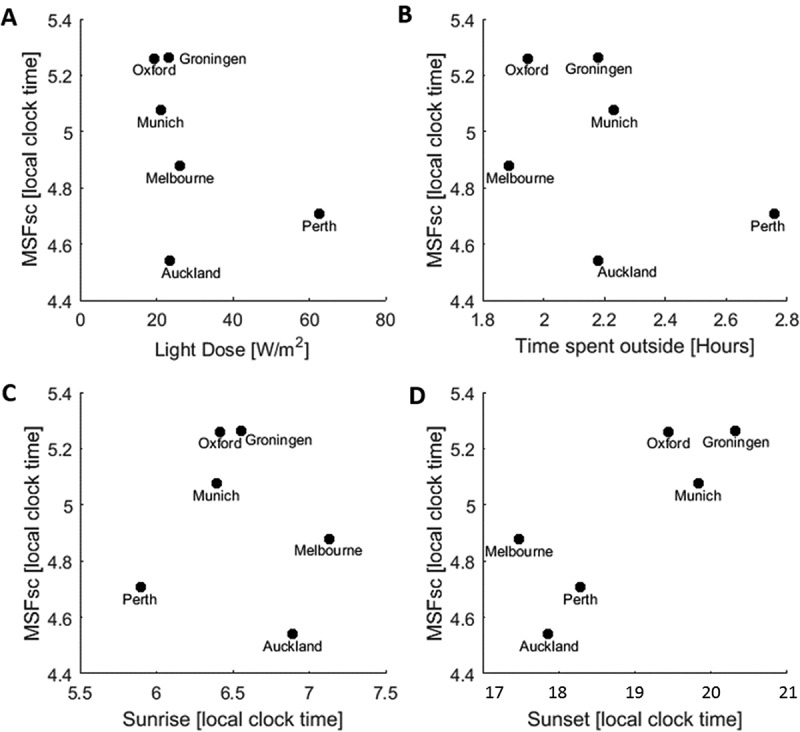
Geographical location, MSFsc and ambient light conditions. Average MSFsc for each city plotted against light dose (a), time spent outside (b), time of sunrise (c) and time of sunset (d). Sunset times given as hours from midnight.
Official websites use .gov
A
.gov website belongs to an official
government organization in the United States.
Secure .gov websites use HTTPS
A lock (
) or https:// means you've safely
connected to the .gov website. Share sensitive
information only on official, secure websites.
Geographical location, MSFsc and ambient light conditions. Average MSFsc for each city plotted against light dose (a), time spent outside (b), time of sunrise (c) and time of sunset (d). Sunset times given as hours from midnight.