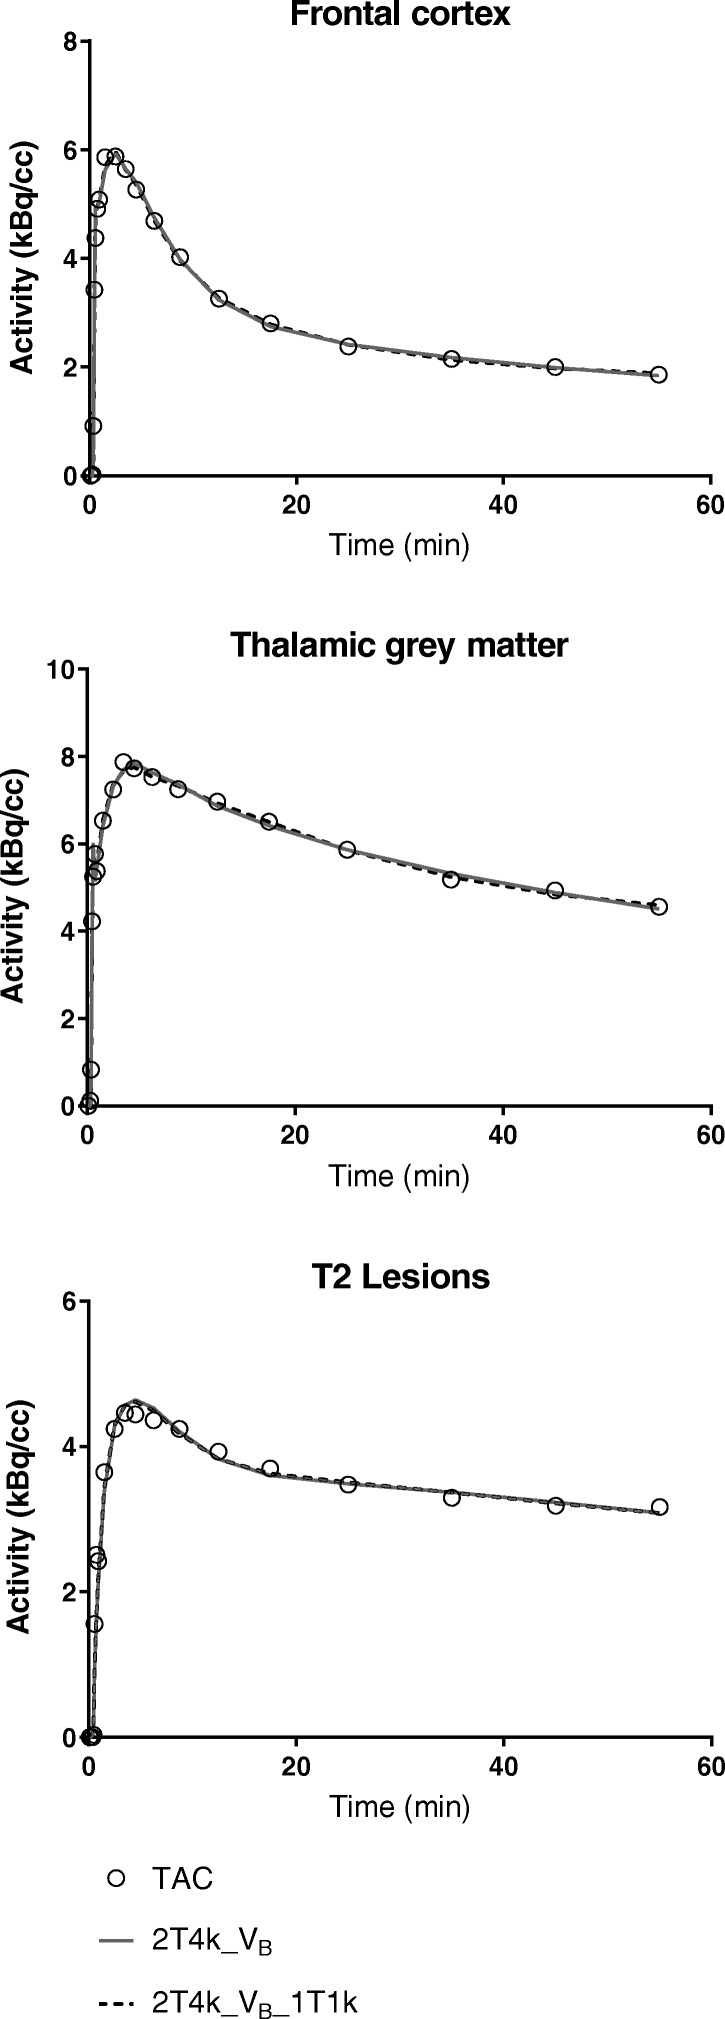
Fig. 2.

Model fit comparisons. Representative model fits for the frontal cortex of a medium affinity binding healthy control, the thalamic grey matter of a high-affinity binding MS patient and the T2 lesions of a medium-affinity binding MS patient. The open circles represent the measured time-activity curves (TAC) and the solid grey and dashed black lines represent the fits for the reversible two-tissue compartment model without and with vascular binding component (2T4k_VB and 2T4k_VB_1T1k)
