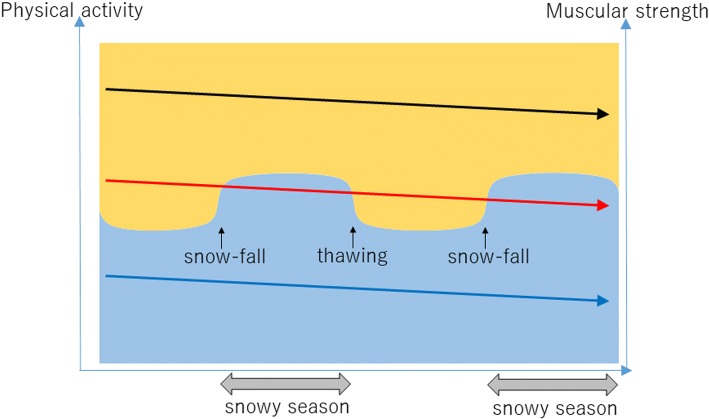
Fig. 1.
Hypothesis of seasonal fluctuation on muscle strength required to perform physical activity. The vertical axes represent muscle strength and physical activity. The background color refers to physical activity; the blue zone implies physically inactive, whereas the orange zone implies active. Three different levels of muscle strength are displayed using the three arrows in Fig. 1. The arrows represent individuals with different muscle strength levels; the black, blue, and red arrows represent adequate muscle strength, remarkably low muscle strength, and intermediate muscle strengths, respectively. The gentle downward slope of each arrow represents muscle weakness due to aging. Although these arrows may slope downward due to a certain event or the degree of slope may differ between individuals, the arrows are presented as even lines here. The black arrow indicates individuals who are physically active throughout the year, and, likewise, blue indicates those who are inactive. The individuals represented by the red arrow show seasonal fluctuations in physical activity, with adequate physical activity during the non-snowy season and inactivity during the snowy season

