Figure 6.
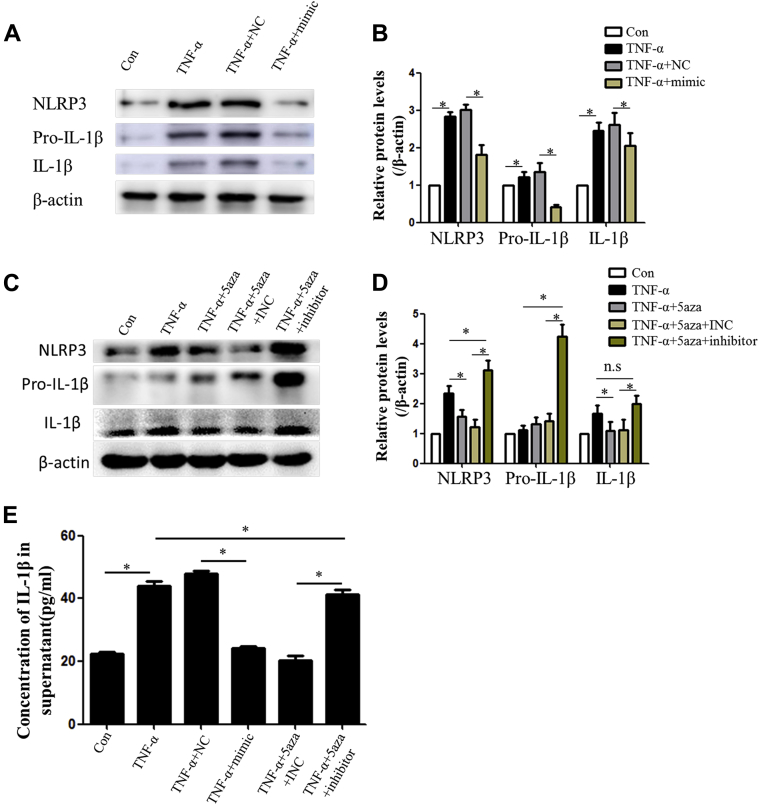
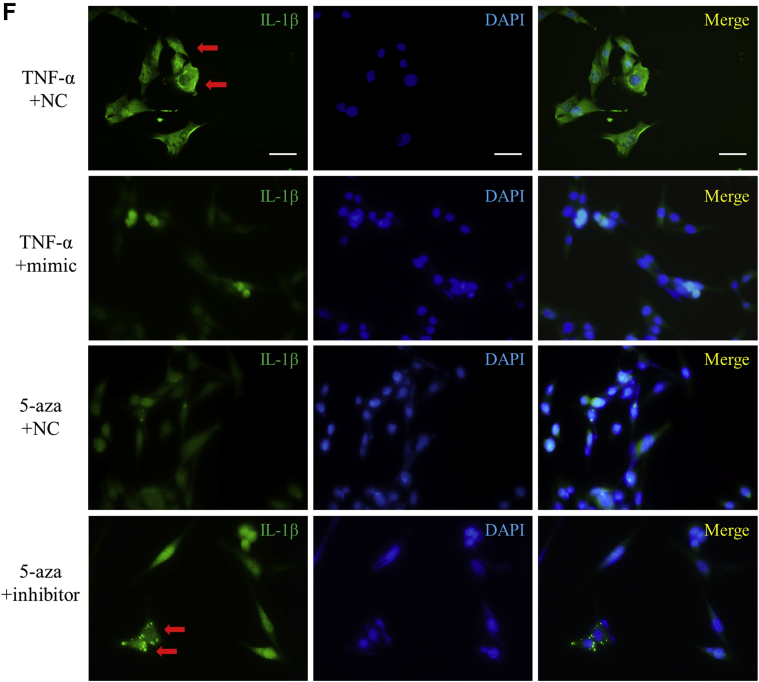
MiR-145 Inhibited NLRP3 Inflammasome Activation Induced by TNF-α in Vascular Smooth Muscle Cells
(AandB) Western blot and quantitative results of NLRP3, pro-IL-1β, and mature IL-1β in vascular smooth muscle cells treated with TNF-α and the miR-145 mimic (100 nmol/l). Values are mean ± SEM of 3 samples in each group; *p < 0.05. (CandD) Western blot and quantitative results of NLRP3, pro-IL-1β, and mature IL-1β in vascular smooth muscle cells treated with 5-aza and the miR-145 inhibitor (100 nmol/l). Values are mean ± SEM of 3 samples in each group; *p < 0.05. (E) Concentration of IL-1β in supernatants of vascular smooth muscle cells with different treatments. Values are mean ± SEM of 3 samples in each group; *p < 0.05. (F) Immunofluorescence of IL-1β accumulation in vascular smooth muscle cells with different treatments. INC = inhibitor control; NC = mimic control; other abbreviations as in Figures 1, 2, and 3 and 5.


