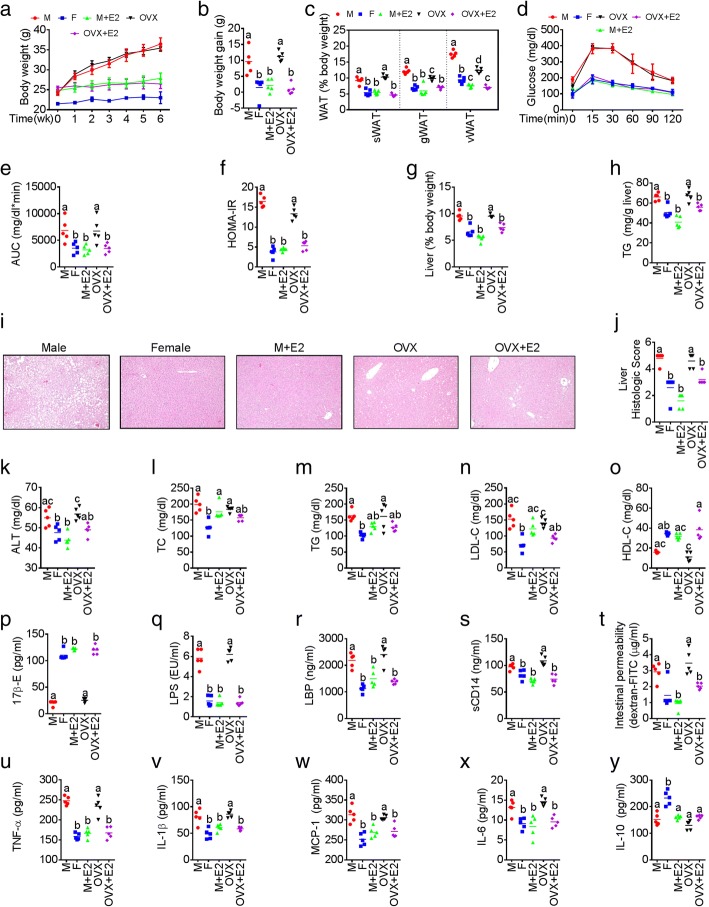
Fig. 1.
Sexual differences in ME and LGCI are associated with sexual dimorphism in obesity and MS. Male (M), normal female (F), and ovariectomized (OVX) female mice were divided in to five groups (M, F, M+E2, OVX, and OVX+E2; n = 5/group) and were fed western diet (WD) ± 17β-estradiol (E2) in the drinking water for 6 weeks. Markers for sexual dimorphism in metabolic syndrome (MS) (a–o), metabolic endotoxemia (ME) (q–t), and low-grade chronic inflammation (LGCI) (u–y) were studied. a Weekly body weight. b Body weight gain. c White adipose tissue (WAT) weight. d Glucose tolerance test (GTT). e GTT area under curve (AUC). f Homeostatic model assessment-insulin resistance (HOMA-IR). g Liver weight. h Liver triglyceride. i Hematoxylin and eosin-stained liver specimens showing histological evidences for fatty liver. j Fatty liver score. Serum levels of alanine aminotransferase (ALT) (k), total cholesterol (TC) (l), triglyceride (TG) (m), low-density lipoprotein cholesterol (LDL-C) (n), high-density lipoprotein cholesterol (HDL-C) (o), E2 levels (p), lipopolysaccharides (LPS) (q), LPS-binding proteins (LBP) (r), and soluble CD14 (sCD14) (s). t Serum levels of FITC-dextran macromolecules indicating intestinal permeability differences. Serum levels of cytokines such as TNF-α (u), IL-1β (v), MCP-1 (w), IL-6 (x), and IL-10 (y). Data are expressed as mean ± SE. Box plots (box showing the median, and the 25th and 75th percentiles, and the whiskers of the graph show the largest and smallest values) were used. Data with different superscript letters are significantly different (P < 0.05). Ordinary or repeated measures one-way ANOVA followed by Tukey’s multiple comparisons test

