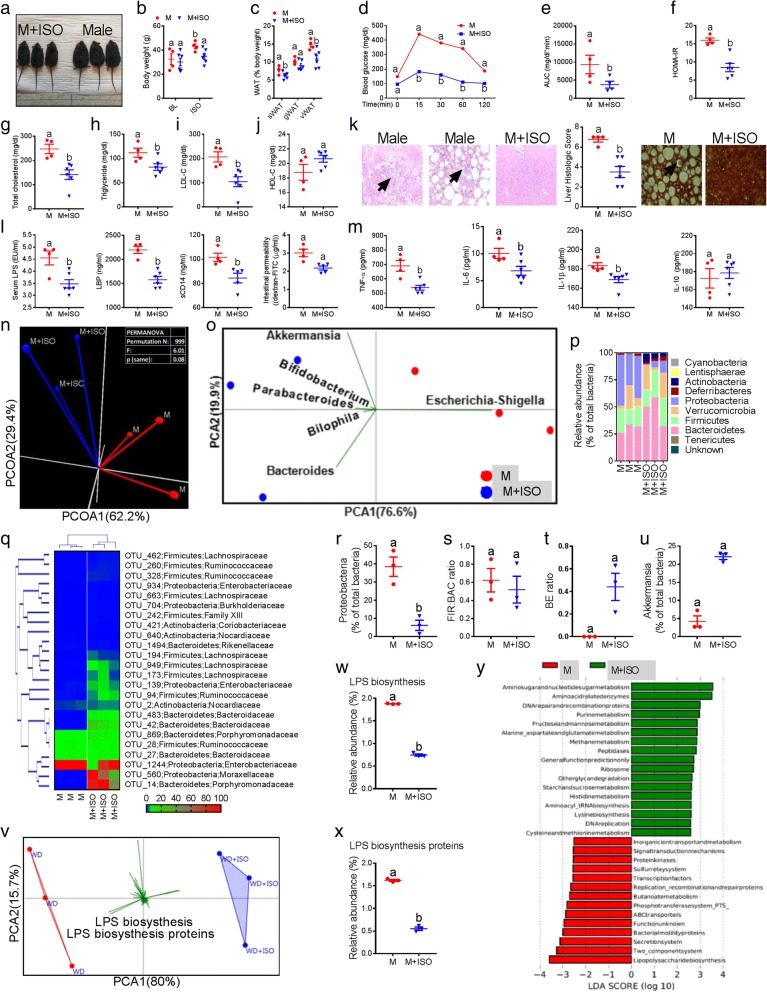
Fig. 5.
Isoflavones produce similar microbiome-modifying effects as estrogens and reverse MS. Male mice with obesity and metabolic syndrome features were divided into Male (n = 4) and Male+ISO (n = 6) groups. Male+ISO group received supplementation of both genistein (G) and daidzein with a WD. a–k Metabolic syndrome markers such as gross appearance and body weight (a-b) and white adipose tissue (WAT) weight (c), glucose tolerance test curves with area under the curve (AUC) (d, e) and insulin resistance (HOMA-IR) (f), serum total cholesterol, triglycerides, LDL-C and HDL-C (g–j) histological evidences showing non-alcoholic fatty liver disease features (arrow heads indicating inflammatory cells infiltration, Mallory bodies and mild fibrosis) (k). l Markers of metabolic endotoxemia (serum LPS, LBP, sCD14, and intestinal permeability). m Markers of low-grade chronic inflammation (TNF-α, IL-6, IL-1β, and IL-10). n β-diversity analysis using principal coordinate analysis (PCOA) with Bray-Curtis dissimilarity index (BCD) followed by PERMANOVA significance test. o SIMPER with BCD analysis followed by principal component analysis (PCA) (variance-covariance type) showing the top six operational taxonomic unit (OTU) scores included as vectors. p Analysis at the phylum level using RA (%). q Hierarchical clustering with a heat map shows the relative abundance (RA) of representative OTUs (those with greatest difference between groups) group means from each family selected for P < 0.05, obtained with differential abundance analysis. r–u Box plots showing the Proteobacteria, Firmicutes (FIR) to Bacteroidetes (BAC) ratio, Bifidobacterium (B) to Enterobacteriacea (E) ratio, and RA of genus Akkermansia. v RA of predicted microbial genes was identified using PICRUSt analysis followed by PCA (variance-covariance type) and the resulting scores were included as vectors. w, x RA of lipopolysaccharide (LPS) biosynthesis and LPS biosynthesis proteins. y LDA scores derived from LEfSe analysis conducted on predicted microbial genes identified by PICRUSt, showing the biomarker functions. Data was shown as mean ± SEM. Data with different superscript letters are significantly different (P < 0.05). Student’s t test or repeated measures one-way ANOVA followed by Tukey’s multiple comparison test

