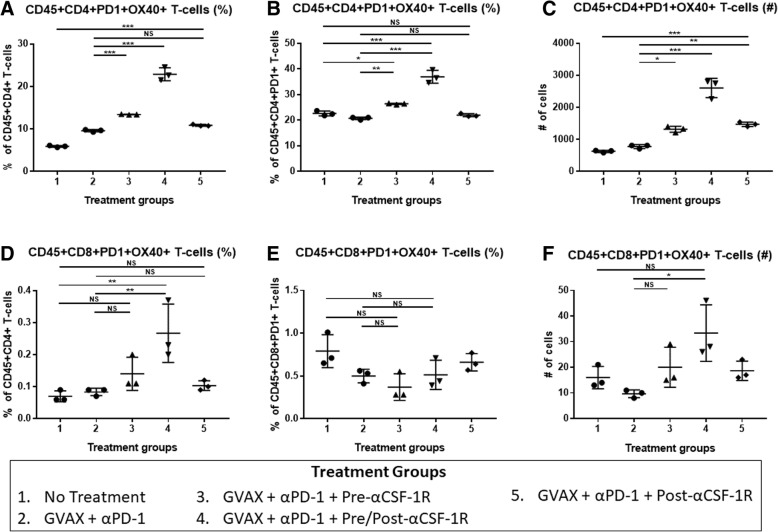
Fig. 4.
The PD-1 + OX40+ CD4+ T-cells increase with the addition of αCSF-1R to GVAX therapy and αPD-1. Liver metastatic KPC tumor-bearing mice were sacrificed on day 14 after receiving treatment, and flow cytometry analysis was performed on the isolated tumor infiltrating immune cells. The percentage of PD-1 + OX40+ cells within the (a) CD45 + CD4+ and (d) CD45 + CD8+ T-cell populations. The proportion of cells expressing OX40+ amongst (b) CD45 + CD4 + PD-1+ and (e) CD45 + CD8 + PD-1+ T-cells. The number of (c) CD45 + CD4 + PD-1 + OX40+ and (f) CD45 + CD8+ PD-1 + OX40+ T-cells. N = 3 for each treatment group, and the isolated immune cells from mice from the same treatment group were pooled and measured in triplicates. *p < 0.05; **p < 0.01; ***p < 0.001; NS, non-significant

