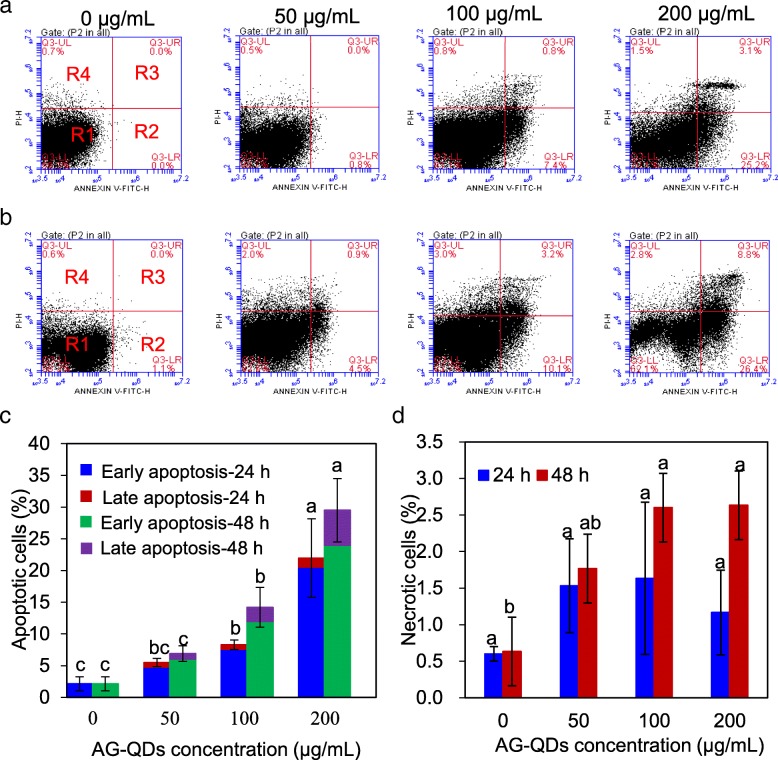
Fig. 2.
Apoptosis and necrosis of NR8383 cells during 24- and 48-h AG-QDs exposure as detected by flow cytometry. a, b: Representative flow cytometer images of NR8383 cells after exposed to AG-QDs (0, 50, 100 and 200 μg/mL) for 24, and 48 h. For each image in panels (a) and (b), the areas R1, R2, R3, and R4 indicate viability, early apoptosis, late apoptosis, and necrotic cells, respectively. c, d: Quantitative results of apoptotic and necrotic percentages from flow cytometry analysis. In panels (c) and (d), for a given exposure time, significant difference on apoptotic or necrotic cells among AG-QDs concentrations is marked with different letters (p < 0.05, LSD test, n = 6)

