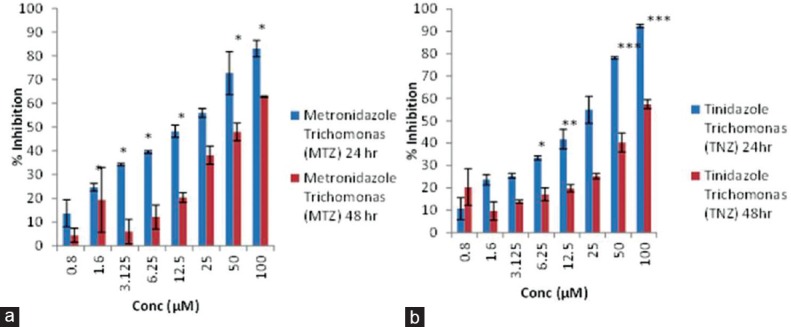
Figure 5.

Graph plot to show variation in percentage inhibition of metronidazole (a) and tinidazole (b) on Trichomonas vaginalis at two time points, i.e., 24 and 48 h. Data were expressed as mean ± standard deviation (*) =p< 0.05, (**) =p< 0.005, (***) =p< 0.0005
