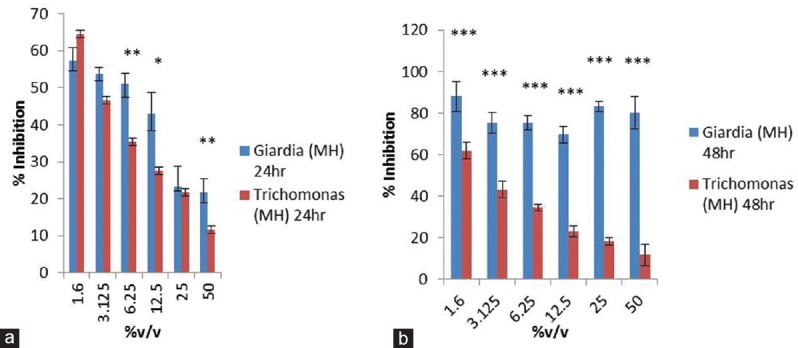
Figure 8.

Graph plot to show intervariation in percentage inhibition of Giardia lamblia and Trichomonas vaginalis after manuka honey exposure for 24 (a) and 48 h (b). Data were expressed as mean ± standard deviation (*) =p< 0.05, (**) =p< 0.005, (***) =p< 0.0005
