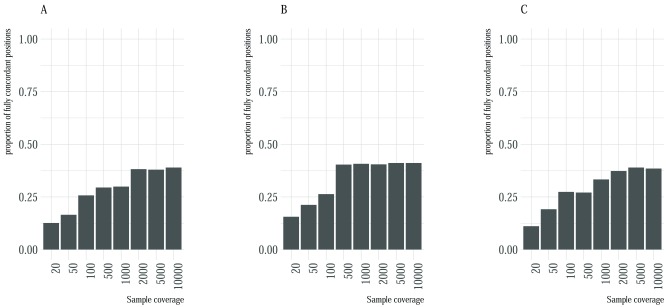
Figure 2. Proportion of fully concordant positions with respect to sample coverage.
Each plot A– C represents the proportion (y-axis) of fully concordant variants with respect to read coverage (x-axis) for the first, second and third dataset. Concordant positions were defined as positions that were identified by all the four variant callers.

