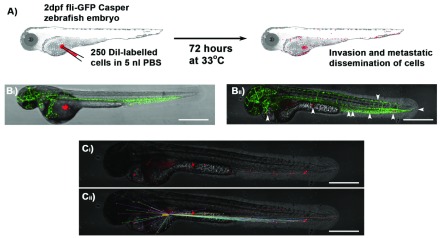
Figure 1. Schematic of xenograft assay and analysis of cell migration.
A) Site-specific injection (depicted into the yolk sac) of DiI- or RFP-labelled (Red) cancer cells in 5 nl PBS into 2 dpf zebrafish embryos is followed by incubation of zebrafish for 72 hours at 33°C and subsequent imaging analysis of invasion and metastatic dissemination of cancer cells. B) Approximately 250 DiI-labelled A375 melanoma cells 0 hrs ( Bi) and 72 hrs ( Bii; white arrows indicate position of melanoma cells) after injection into the yolk sac of Tg(kdrl-GFP) Casper zebrafish (Green blood vessels). C) Confocal z-stack images are used to visualise red DiI fluorescence of melanoma cells within zebrafish ( Ci) and the distance from injection site measured using Volocity image analysis software ( Cii); Scale bar = 500 μm.

