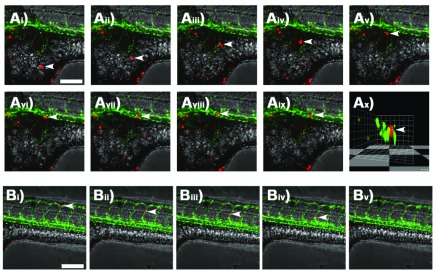
Figure 2. Single cell tracking by time-lapse confocal microscopy.
Ai– ix) Confocal z-stack images taken at 15 minute intervals showing an individual DiI-labelled A375 melanoma cell (white arrows) migrating within the yolk sac of a casper zebrafish embryo and interacting with a GFP-tagged blood vessel. Ax) 3D-render of image Aix rotated to show the transverse section through the GFP-tagged blood vessel with DiI-labelled melanoma cell indicated by white arrows. Bi– v) Confocal z-stack images taken at 15 minute intervals showing an individual DiI-labelled melanoma cell (white arrows) within the GFP-tagged blood vessels of a casper zebrafish embryo. Scale bar = 150 μm.

