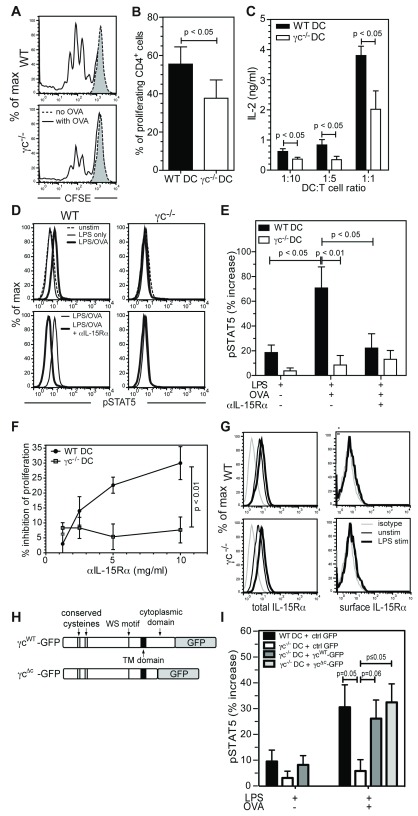
Figure 1. γc -/- DC fail to transpresent IL-15 to CD4+ T cells during antigen-specific priming.
( A) Representative plots showing CFSE dilution in CD4+-gated OTII T cells after co-culture with LPS-matured OVA-pulsed DC for 72 hrs. Grey dotted histograms represent CD4+ T cells cultured with DC in the absence of antigen. ( B) Quantification of T cell proliferation shown in A. ( C) IL-2 release by CD4+ T cells incubated with OVA-pulsed DC at the indicated ratios for 72hrs. ( D) pSTAT5 induction in CD4+ T cells following a 10 minute incubation with DC, either untreated or stimulated overnight with LPS ± OVA. DC were blocked with anti-IL-15Rα or isotype control. ( E) Increase in pSTAT5 fluorescence ( D), compared to unstimulated control. ( F) Inhibition of CD4+ T cell proliferation after co-culture for 72hr with OVA-pulsed DC pre-treated with anti-IL-15Rα (relative to isotype-matched control antibody treatment). ( G) Total and surface IL-15Rα expression (FAB551F) on CD11c gated cells. ( H) Schematic of construct encoding full length (γc WT-GFP) and truncated (γc Δc-GFP) γc attached to GFP. ( I) Increase in pSTAT5 levels, compared to unstimulated control, in CD4+ T cells following incubation with DC ±OVA, transfected with γc WT-GFP, γc Δc-GFP or ctrl GFP. P values, t-test ( B, C, I) ; one-way ANOVA ( E); linear regression (p value tests for significant difference between the slope of each line) ( F).

