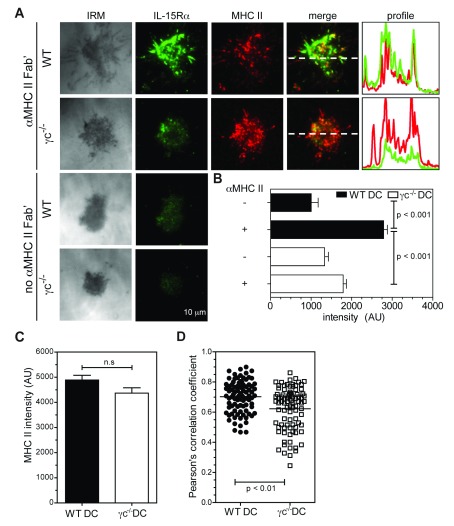
Figure 4. IL-15Rα is recruited to the DC interface and colocalizes with engaged MHCII.
LPS/OVA stimulated DC were incubated on glass-supported planar bilayers containing LFA-1 αI ± I-A/E Fab’. After 15 min incubation at 37°C in HBS/HSA buffer, cells were fixed, permeabilized and stained for IL-15Rα (Alexa Fluor 488) in PBS buffer. ( A) Representative TIRFM images showing IL-15Rα and MHCII (Alexa Fluor 568) accumulation at contact interfaces. Fluorescence intensity profiles (right panels) indicate the distribution of IL-15Rα (green) and MHCII (red) along the dashed white lines (merge). ( B, C) Quantification in arbitrary units (AU) of mean IL-15Rα fluorescence ( B) and MHCII fluorescence ( C) at DC contact interfaces shown in A (N=89-90, mean ± S.E.M). ( D) Quantification of colocalization between MHCII and IL-15Rα at DC contact interfaces ( A), calculated as Pearson’s correlation coefficient (PCC). Imaging was performed on a Nikon Ti microscope with a 100x TIRF objective, N.A. 1.49, controlled by Nikon Elements software. Fluorescence images were captured using an Ixon cooled EMCCD camera (512 x 512 pixels, Andor Technology). Mean fluorescence intensity at contact interfaces was quantified from 14 bit images using Metamorph software. PCC was calculated for MHCII and IL-15Rα fluorescence channels using ImageJ software. Brightness and contrast are adjusted uniformly across image groups for clarity.

