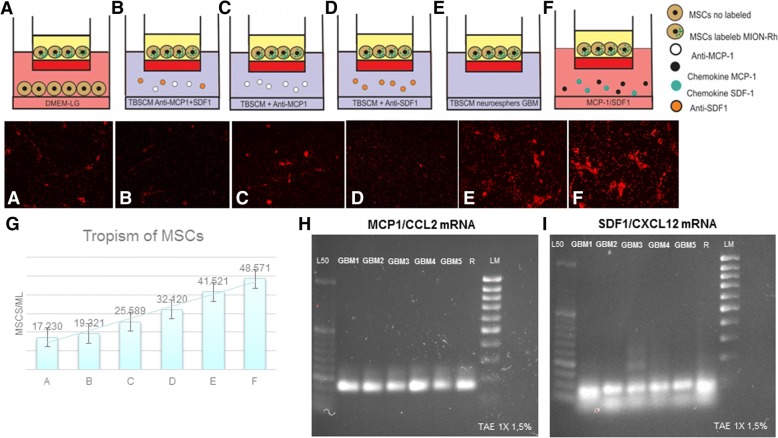
Fig. 3.
Representative figure of migration assays of MSCs, in transwell dishes, in different conditions placed in the lower chambers: a MSCs not labeled [control], b conditioned medium supplemented with specific neutralized antibodies (anti-MCP-1 and anti-SDF-1), c conditioned medium supplemented with specific neutralized antibodies (anti-MCP-1), d conditioned medium supplemented with specific neutralized antibodies (anti-SDF-1), e CD133+ cell culture supernatants (TBSCM), f chemokines MCP-1 and SDF-1, g graph summarized of mean number of migrated MSCs in relation to different conditions, h RT-PCR analysis of MCP-1/CCL2 mRNA levels expressed in CD133+ GBM cells (n = 5; GBM1 GBM2 GBM3 GBM4 GBM5). i RT-PCR analysis of SDF-1/CXCL12 mRNA levels expressed in CD133+ GBM cells (n = 5; GBM1 GBM2 GBM3 GBM4 GBM5). L50: Ladder 50 bp; LM low mass ladder; R positive control (human reference total RNA Clontech)

