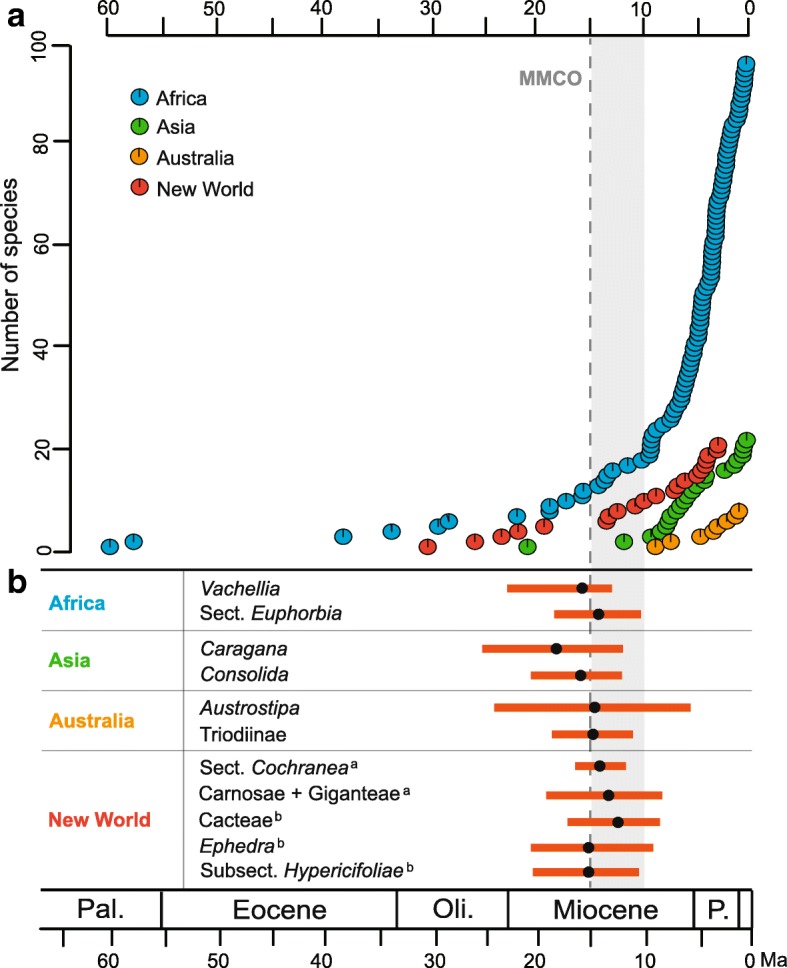
Fig. 4.

Diversification of plant groups in drylands. a Zygophyllaceae species accumulation estimates over time. Pie diagrams are color coded to reflect the proportion of alternative ancestral distributions obtained by the S-DIVA. b The timing of diversification for eleven representative plant groups in different dryland regions. The dark spots and their corresponding scale bars represent the mean ages and 95% HPD intervals (see Discussion for details). a, bTaxa are from tropical America and western North America, respectively. Abbreviations: Pal. = Paleocene; Oli. = Oligocene; P. = Pliocene
