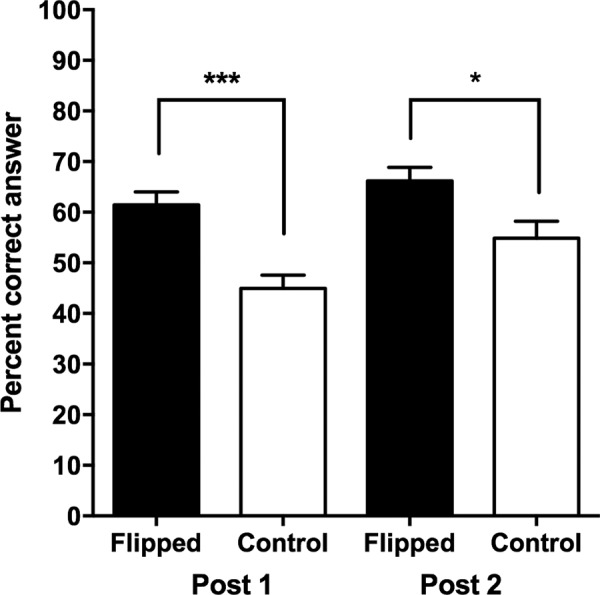
FIGURE 3.

Percent of correct answers to the question set in the flipped and control sections at the beginning (post 1) and the end (post 2) of class. Post 1 was administered after the concepts were taught (via either flipped methodology or control lecture approach). Significant differences were observed between students in the flipped (N = 46) and control (N = 38) sections by t tests (p < 0.001 and p = 0.017 for post 1 and post 2, respectively).
