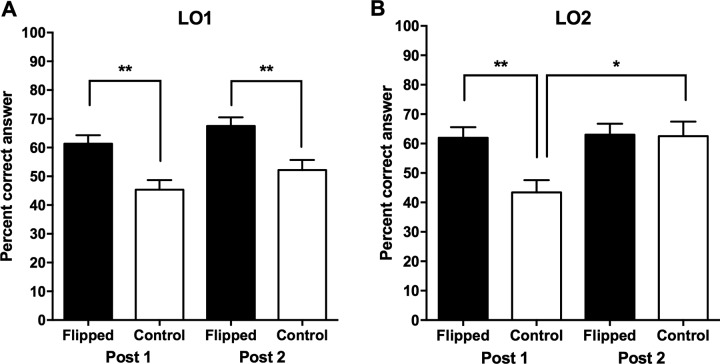
FIGURE 4.
Percent correct answers based on learning outcomes (LOs) for post 1 and post 2 (flipped, N = 46; control, N = 38). (A) LO1 significant differences were observed between students in the flipped and control sections by t tests (p < 0.001 and p = 0.001 for post 1 and post 2, respectively). (B) LO2 significant differences were observed between students in the flipped and control sections by t tests for post 1 (p = 0.001) but not post 2. LO2 scores of students in the control sections improved significantly from post 1 to post 2 (p = 0.001).

