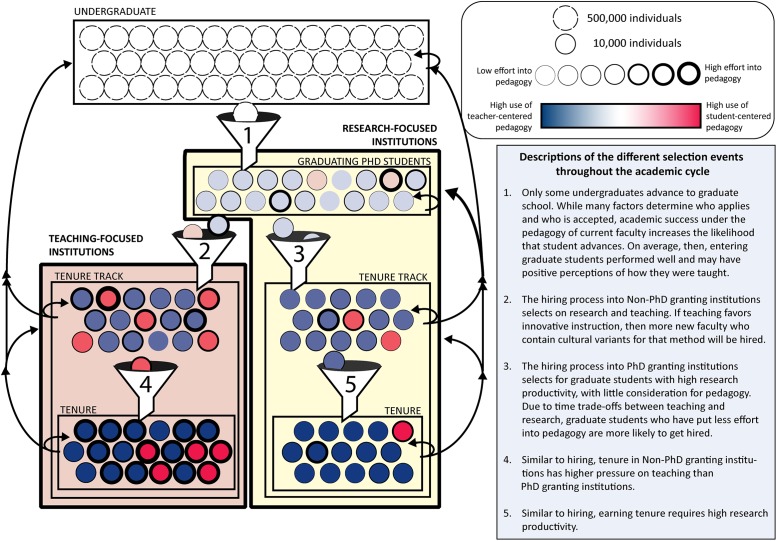
FIGURE 1.
A visual representation of our cultural evolutionary model. Circles represent individuals who move through the academic pipeline. The size of each circle represents an estimate of the number of enrolled undergraduates, graduating PhD students, and working tenure-track and tenured faculty at PhD-granting and non–PhD granting institutions (Snyder et al., 2016). Individuals accumulate cultural variants tied to pedagogy as they move through the pipeline, indicated by black arrows. Individuals advance based on criteria that weigh pedagogical practices to varying degrees. The color of each circle represents the likelihood of that individual teaching a certain way, with the color dependent on their accumulated cultural variants. Thus, if one color is at a higher frequency in the tenured faculty compartment, it represents a state where most tenured faculty practice that pedagogical behavior. The border thickness of each circle represents how much effort that individual allocates into pedagogy, which comes at the expense of effort that could be allocated to research. The proportions of pedagogical variants and effort are meant for illustration only, and do not reflect collected empirical data. Black arrows indicate cultural transmission.

