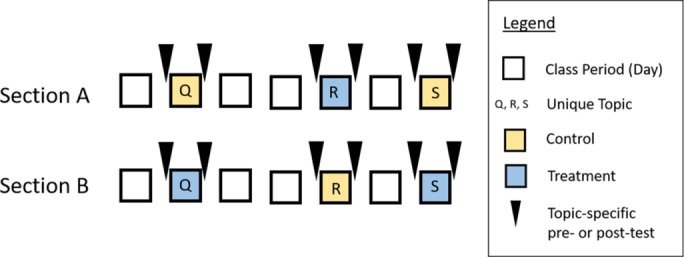
FIGURE 2.

Experimental design in the extended example. Squares represent class days (note that there were more class days in the course and the spacing between interventions is not to scale). Experimental treatment and control are color coded as yellow and blue, respectively. Unique topic is indicated with the letters “Q,” “R,” and “S.” The pre- and posttests (black triangles) on each day were identical. The fact that students took a posttest three times made the students “repeated measure” and warranted students being treated as random effects. Additionally, students were clustered in sections (and section was not synonymous with intervention), so section was tested as a possible random effect. The experimental design was unbalanced, such that section A received the control twice and the treatment once, whereas section B received the treatment twice and the control once.
