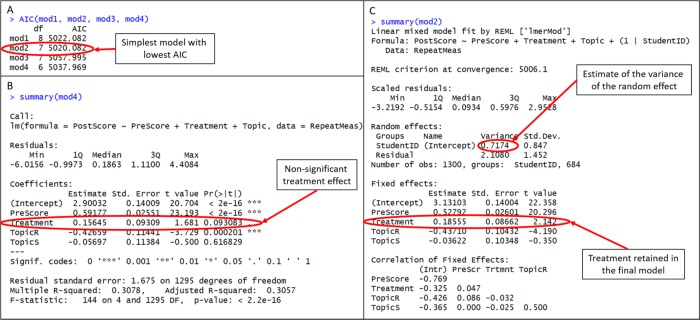
FIGURE 7.
R output from code in Figure 3: (A) step 3 of model selection (comparing AIC values for each model that was fit); (B) model 1, which did not include any random effects; and (C) the best-fitting multilevel model with student as the only random effect. Note that treatment was retained in the final model, noting a treatment effect and supporting the hypothesis that the treatment is positively correlated with postscore.

