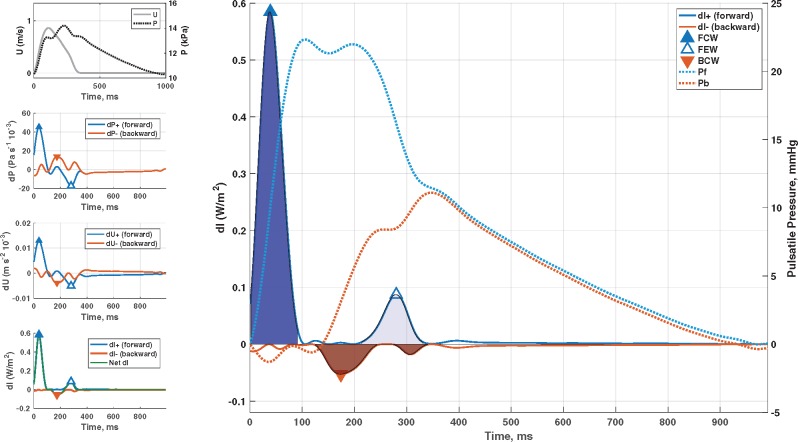
Figure 2.
Wave separation analysis vs. wave intensity analysis. Identification of forward-travelling and backward travelling waves in the proximal aorta using wave intensity analysis. The method is based on the assessment of changes in pressure (P) and flow velocity (left panels), which can be multiplied to compute instantaneous wave intensity (left bottom panel). The right panel shows forward and backward wave intensity curves, which can be analysed to identify the timing and magnitude of key wave fronts: early systolic forward compression wave (dark blue), late systolic forward suction wave (light blue), and backward compression wave (red). The cumulative sum of forward and backward pressure changes (dP, used to computed wave intensity) are superimposed on the right y-axis. These curves (Pf, Pb) are equivalent to forward and backward waves obtained via classic wave separation analysis. It can be seen that wave intensity tends to markedly under-represent reflected waves, because it emphasizes rapid changes in pressure and flow (high frequencies), whereas reflected waves are enriched in lower frequencies. BCW, backward compression wave; FCW, forward compression wave; FEW, forward expansion suction wave.

