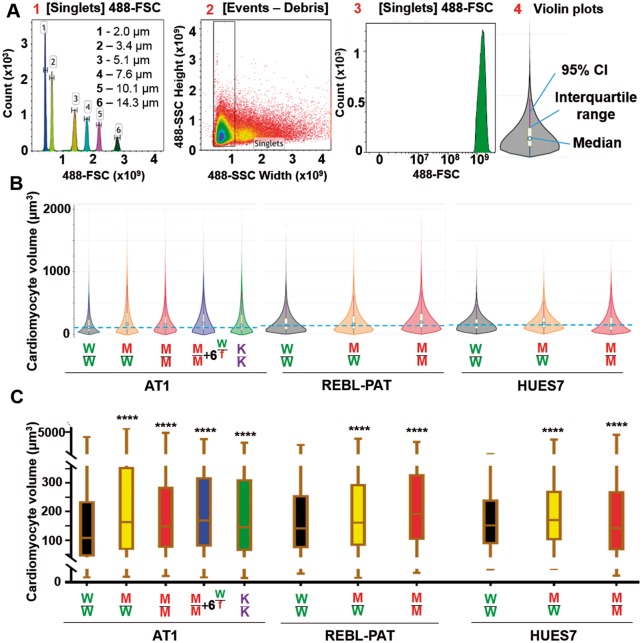
Figure 2.
Flow cytometry calculation of human pluripotent stem cell-cardiomyocyte hypertrophy. (A) Calibration of forward scatter (FSC) from predefined beads sizes allowed human pluripotent stem cell-cardiomyocyte size quantification. (B) Violin plots (25 000 cells/sample) show volume of AT1 (n = 9), REBL-PAT (n = 6), and HUES7 (n = 3) lines. Dotted blue line indicates median of volume of isogenic controls. (C) Box/whiskers plots show interquartile range of volume, and highlights higher median and first quartile metrics in gene-edited lines. P-values, one-way ANOVA test + Dunnett’s correction; ****Significance all <0.0001.

