FIG 2.
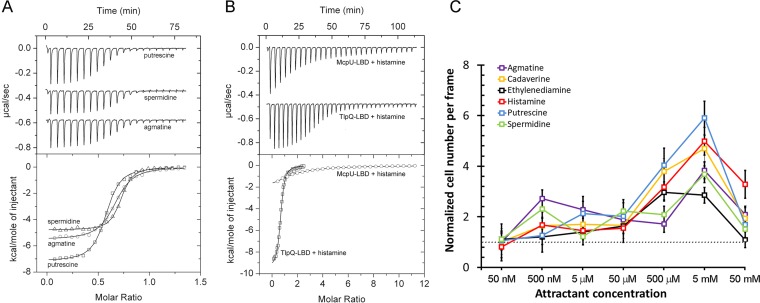
Identification and analysis of TlpQ ligands. (A) Microcalorimetric titrations of 15 µM TlpQ-LBD with 4.8 µl aliquots of 250 µM putrescine, spermidine, or cadaverine. (B) Microcalorimetric titration of 17.5 µM McpU-LBD with 9.6 µl aliquots of 1 mM histamine and titration of 15 µM TlpQ-LBD with 4.8 µl aliquots of 250 µM histamine. Upper graphs show raw titration data, while lower graphs show integrated corrected peak areas of the titration data fit using the “one binding site model.” The derived thermodynamic parameters are provided in Table 1. (C) Quantitative capillary chemotaxis assays of P. aeruginosa PAO1 toward TlpQ ligands. Shown are the ratios of cells after 2 min of exposure to the chemoattractant relative to the number of cells at the beginning of the experiment. The horizontal line marks the ratio of 1, which is indicative of no chemotaxis; n = 3.

