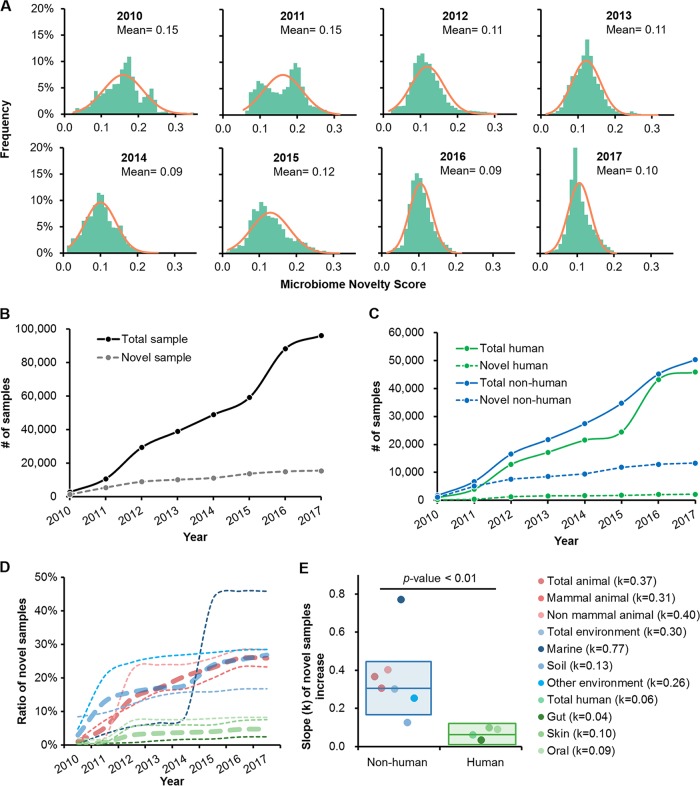
FIG 1.
Historical trend of microbiome novelty scores. (A) The MNSs of samples from 2010 to 2017 followed a normal distribution. In each subpanel, the bar chart represents the frequencies of samples and the curve is the simulated standard normal distribution. (B) Yearly accumulative curves of the total numbers of samples and novel samples. From 2010 to 2017, 15,501 samples were identified as novel microbiomes with an MNS of ≥0.15. (C) Yearly accumulative curves of sample numbers for human samples and nonhuman sample. (D) Yearly development of novel sample ratios (defined as the number of novel samples over the number of total samples) in each category. Thick dotted lines represent the ratios of novel samples in high-level categories (human, animal, and natural environments), while thin dotted lines are those in subcategories. (E) Linearly fitting slopes of novel sample ratio increases in each category. The color schemes are the same for panels D and E.

