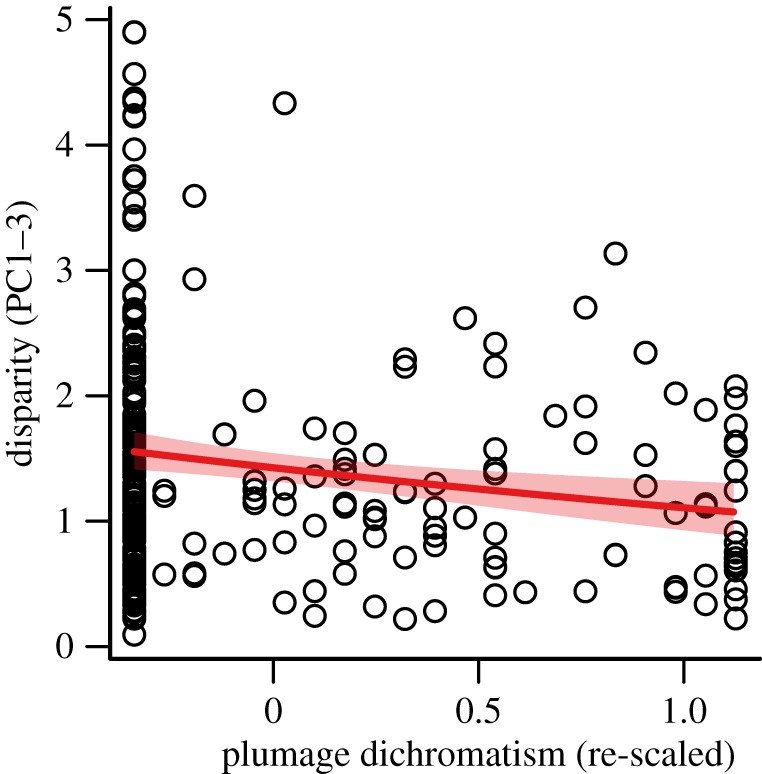
Figure 2.

Scatterplot showing the relationship between total within-pair song disparity (PC1–3) and plumage dichromatism across 259 species pairs of passerine birds. Regression line (with prediction intervals, shaded) indicates the best-fitting relationship between the two variables. (Online version in colour.)
