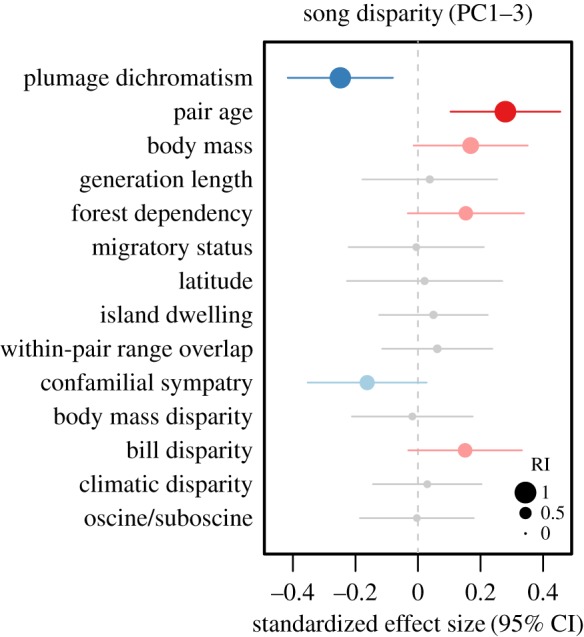
Figure 3.

Model-averaged coefficient estimates from multipredictor GLMs predicting variation in within-pair song disparity (PC1–3) among passerine species pairs (n = 259). Points indicate the standardized effect sizes for each of the (scaled) predictor variables and lines indicate 95% confidence intervals. Sizes of points represent the relative importance (RI) of each of the predictor variables, where a value of RI = 0 indicates low importance and a value of RI = 1 indicates high importance. Predictors included in the AICc top model are coloured (blue, negative effect; red, positive effect), with significant (p < 0.05) model-averaged coefficients shown in darker colours.
