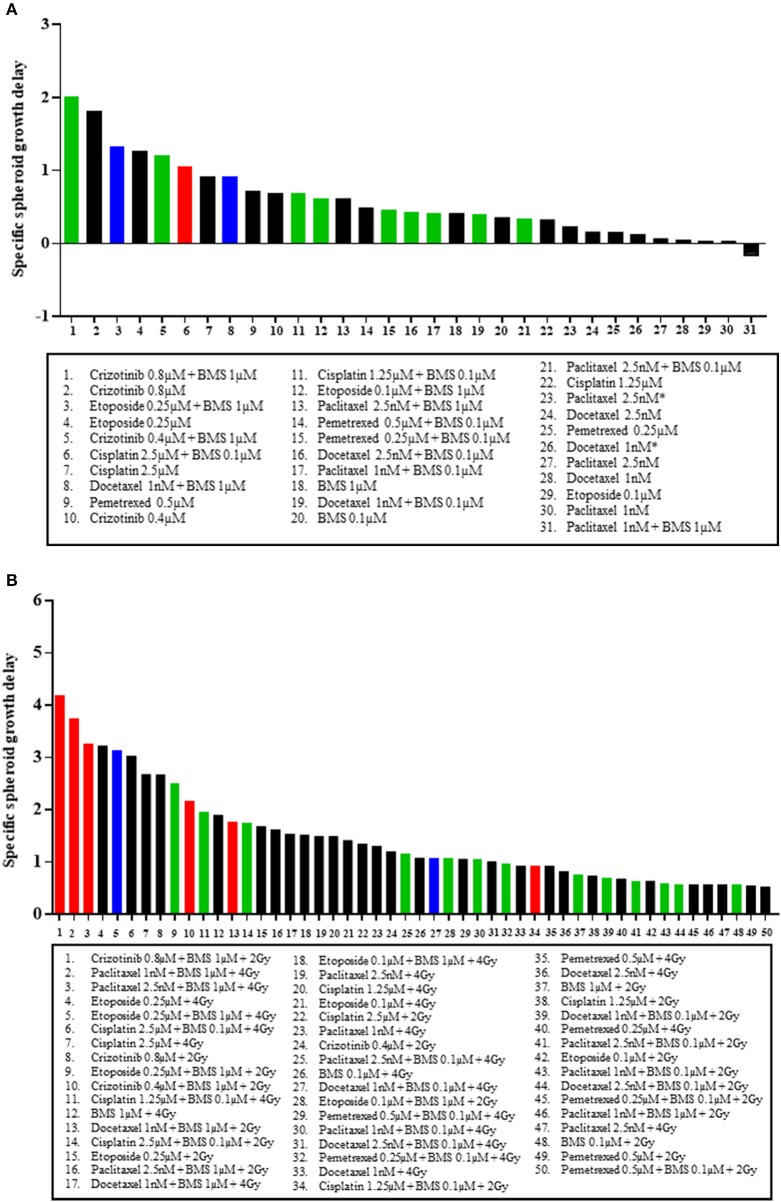
Figure 4.
Top ranking treatment combinations in NSCLC multicellular spheroids. Comparisons in multicellular NCI-H1299 spheroids of: (A) chemotherapeutic at dose specified, and chemotherapeutic plus 0.1 or 1 μM BMS-906024; and (B) chemoradiation (with 2 or 4 Gy), and chemoradiation plus 0.1 or 1 μM BMS-906024. Red bars indicate that the addition of BMS-906024 to that treatment option conferred a statistically significant SSGD compared to the treatment without BMS-906024, and the interaction was synergistic. Green bars indicate only statistically significant SSGD. Blue bars indicate only synergistic interaction. Black bars indicate non-significant relationship.

