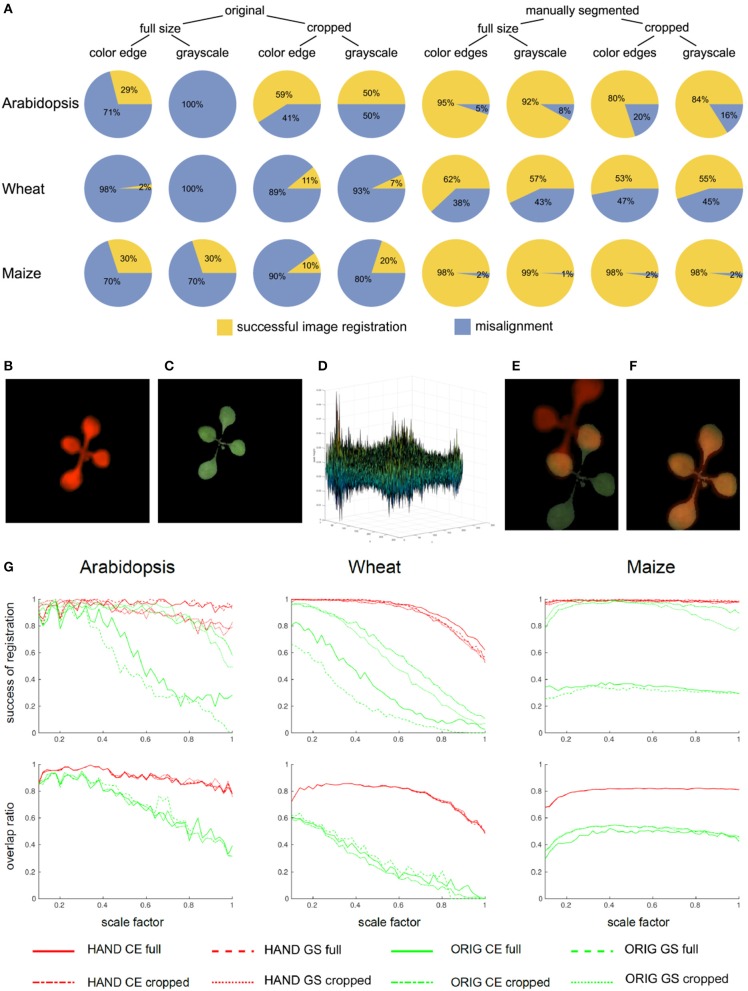
Figure 4.
Statistics of single-step PC registration of original and preprocessed plant images. (A) Pie charts show differences in the relative success rate of PC registration (Equation 8) between different preprocessing conditions including full-size vs. cropped as well as original vs. manually segmented FLU and VIS images. Enhancement of image similarity by means of manual background elimination leads to substantial improvement of PC registration rate. However, cropping of target regions turned out to be not advantageous. Example of a pair of VIS/FLU images (B,C) demonstrates that PC of a young Arabidopsis shoot with very similar leaf exhibits multiple peaks (D). As a consequence of noisy PC the maximum peak may not correspond to the optimal image alignment (E). Downscaling effectively performs image smoothing which improves phase correlation. For the scale factor 0.32, an optimal image alignment was found (F). (G) Plots of success rates and overlap ratios (Equation 9) of PC registration for original (ORIG), hand segmented (HAND full) and cropped (HAND cropped) grayscale (GS) and color-edge (CE) images as a function of scaling ratio [0.1, 1.0]. As one can see, downscaling has strong impact on accuracy of PC registration, however, the optimal scaling factor should not be too low and the optimum lays in the range between [0.3, 0.6]. The overlap ratio lower than 1, especially, for wheat and maize shoots means that single-step PC registration results in an alignment which does not produce a complete coverage of manually segmented plant region in the VIS image by the registered FLU mask.

