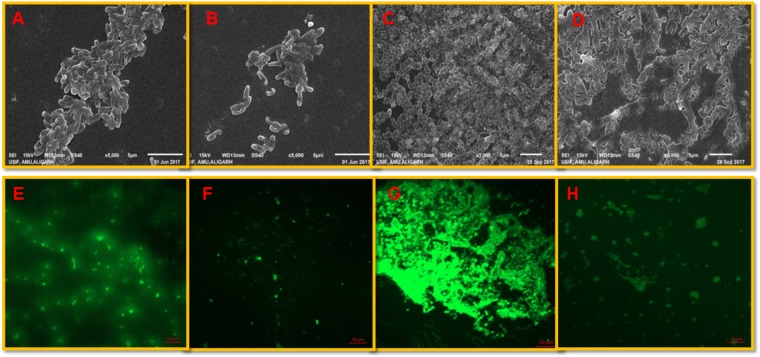
FIGURE 5.
Visualization of biofilm inhibition. P. aeruginosa biofilm: (A,B) shows untreated controls and cells treated with 1/2 × MIC of IONPs as seen by the SEM (E,F) control and treated biofilms stained with acridine orange and visualized by CLSM. L. monocytogenes biofilm: (C,D) shows untreated controls and cells treated with 1/2 × MIC of IONPs as seen by the SEM (G,H) control and treated biofilms stained with acridine orange and visualized by CLSM.

