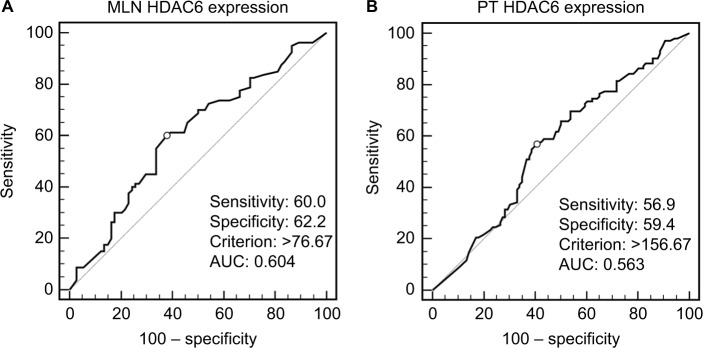
Figure 2.
ROC curves used HDAC6 expression scores of (A) MLNs and (B) PTs to select cutoff values. The optimal cutoff value was determined by maximizing an AUC to discriminate between survival and 18-month cancer-specific death.
Abbreviations: AUC, area under the ROC curve; HDAC6, histone deacetylase 6; MLN, metastatic lymph node; PT, primary tumor; ROC, receiver operating characteristics.

