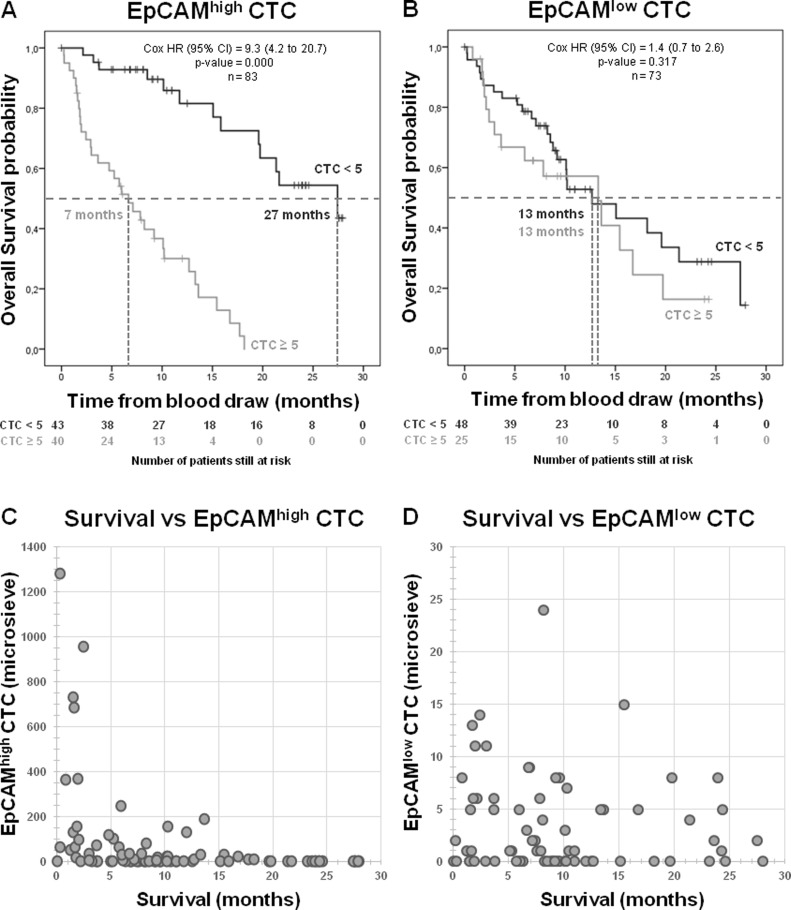
Figure 4. Overall survival for CRPC patients.
Kaplan–Meier curve of overall survival of patients with EpCAMhigh CTC from CellSearch (A), EpCAMlow CTC from microsieves (B) show a strong correlation between EpCAMhigh CTC and survival, but no correlation between EpCAMlow CTC and survival. Scatter plot of survival versus the amount of EpCAMhigh CTC (n = 83) visualizes the expected trend that most patients with high number of CTC have a short survival (C), whereas the amount EpCAMlow CTC in patients (n = 73) show no such trend (D).

