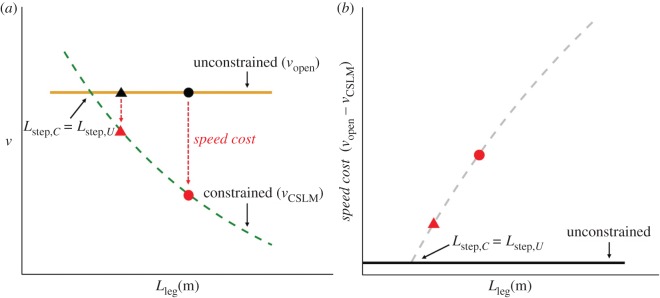
Figure 1.
Depiction of the CSLM and predicted speed costs. (a) The horizontal orange line depicts the preferred dimensionless speed (v)-dimensionless step length (s) relationship from equation (1.1). Note that unconstrained v is independent of Lleg. Unconstrained s and v are depicted for a hypothetical short individual (black triangle) and tall individual (black circle). The green curve shows the relationship between v and Lleg when step length is constrained such that Lstep,C < Lstep,U (equation (1.4)), and the red triangle and circle show s and v for the same hypothetical short and tall individuals. Constraining step length causes a reduction in v, as shown by the red arrows. In the constrained case, v is negatively related to Lleg such that the shorter individual can maintain a faster v than a taller individual. (b) The CSLM-predicted speed cost for the hypothetical short and tall individuals. This quantity is calculated for each individual as vopen − vforest and plotted against the CSLM prediction (grey dashed curve) from panel (a) (vopen – vCSLM). The speed cost is predicted to be greater for taller individuals than for shorter ones. There is no speed cost in the unconstrained environment (black line), and at a small enough stature such that Lstep,C = Lstep,U, the CSLM predicts no speed cost. Note that speed costs may be depicted on either a dimensionless or dimensioned axis.

